Tableau Conference 2025 | Know Before You Go
If you’re a data enthusiast, analytics professional, or just someone curious about Tableau’s latest innovations, the Tableau Conference 2025 is your...
4 min read
 Luke Komiskey
Apr 30, 2020

Raise your hand if you or someone you know has an InstantPot and looooooves it. It’s always amazing when products like this rise to a level of cult-like popularity, seemingly out of nowhere.
What causes that? ….and what does it have to do with data science?
The reason why products like the InstantPot and the iPhone are so popular and beloved by their users is because they were created using the human-centered design process. In the human-centered design process, the very first thing the creators of a product do is get to know their product’s eventual end-users at an intimate level.
Think about it, like the InstantPot, your predictive model and the results it outputs are likely going to be used by a set of human beings in order to inform decisions or adjust business processes and operations. Like the end-users of the InstantPot, your model’s end users have their own core values, needs, goals, and desires. They’re subject to organizational pressures and deadlines. They have their own fears, insecurities, and blind spots.
The best, most accurate predictive model in the world will not reach its true potential when released into the wild of an organization if the data scientist isn’t thinking like a designer and taking all of this into account.
As the field of data science changes, your core job as a data scientist must change also.
Your role as a data scientist must expand to include the skills necessary to bring your model’s end-users along for the ride. Creating an experience of co-creating the model and onboarding it into business processes, while taking into account the values, goals, needs, fears, and insecurities of your end user.
The more you can think like a designer, the more you can employ human-centered data science, the more successful your model will ultimately be because the humans using it will feel empowered and have ownership of the model and its output.
What are their goals? What do they need from the product? What are their barriers and frustrations today? What do they value as human beings? What does their day-to-day life look like?
And only after uncovering the answers to those questions do designers get to work to create a product that fits into the lives of the end-user, helping them meet their goals and needs in alignment with their core values.
The human-centered design process leads to rapid adoption rates and higher usage and engagement rates because it takes into account the unique, and personal needs of the human beings who will be using the product or service. All else being equal, this is the special sauce that causes some products to succeed…while other similar products fail.
This is the most important step of the process. A lot of the time, as developers, we think we know what our end users need, but the truth is we often don't. We need to pause our assumptions and instead let our users become our source of truth and direction.
Take the time to actually sit down and talk with your end users about the situation leading up to the point where they need your model to make a decision, as well as what might come next once they have it.
We think we know what our end-users need, but the truth is we often don't.
Example -
The secret sauce to making you the best data scientist to work with is your ability to figure out what your users need.
From the answers to the questions above we can see that the biggest concern the users have is the accuracy of the predictions compared to the predictions they are currently making themselves. Leveraging your knowledge of the data and the capabilities of Tableau, start by creating a mockup of a potential dashboard in powerpoint or on a white board.
The idea is to get feedback early so time isn’t wasted building something your users don’t want. And most importantly, be sure to be consciously incorporating your understanding of the end-user’s experience into your prototype in a way that lets them know they are being heard and understood.
Once you have your first mock up, schedule a meeting with users and show them your first mock up.
Don't explain, ask more questions and listen.
Here’s the trick: during the meeting, don't start by explaining to them what you created, let them try to figure it out on their own. Watch closely to see where they click first, second, and so on. Have them think out loud so you can hear their thought process. Listen carefully, and take good notes.
Avoid asking leading questions, instead ask open ended questions like "Can you show me how you would interpret or interact with this visualization?" and follow up with questions like "What made you think to try that?".
The goal with this exercise is not to instruct or sell them on your solution, but to simply understand how they intuitively engage with your product to meet their needs.
This process will take you out of the equation and enable your user to design something they understand, are comfortable with, and will meet their needs.
Here is an example of an initial mock up. Below, you can see the final product based off of the mock up and the feedback from the design reviews I had with end users.
All of the new features and enhancements you see were driven by utilizing the human centered design process. It was really the users that designed the final product not me.
The more you can employ human-centered design concepts in your data science projects, the more successful your model will ultimately be because the humans using it will feel empowered and have ownership over the model and its output!
Shaylan Hurley was a consultant at DataDrive for two years. Shaylan firmly believes data is a key component to helping organizations, no matter the size, beat the competition.
April Seifert, Ph.D., is a psychologist, Data Scientist, and Co-Founder of Sprocket CX. She believes in taking a human-centered approach to research and data analysis. For far too long, the field has been riddled with people attempting to act like machines. It’s time for a resurgence of humanity so that we can truly make the most of this powerful field.
-2.gif)
If you’re a data enthusiast, analytics professional, or just someone curious about Tableau’s latest innovations, the Tableau Conference 2025 is your...

Tableau Plus is the new premium offering from Tableau, a leading data visualization and business intelligence platform. It builds upon the...

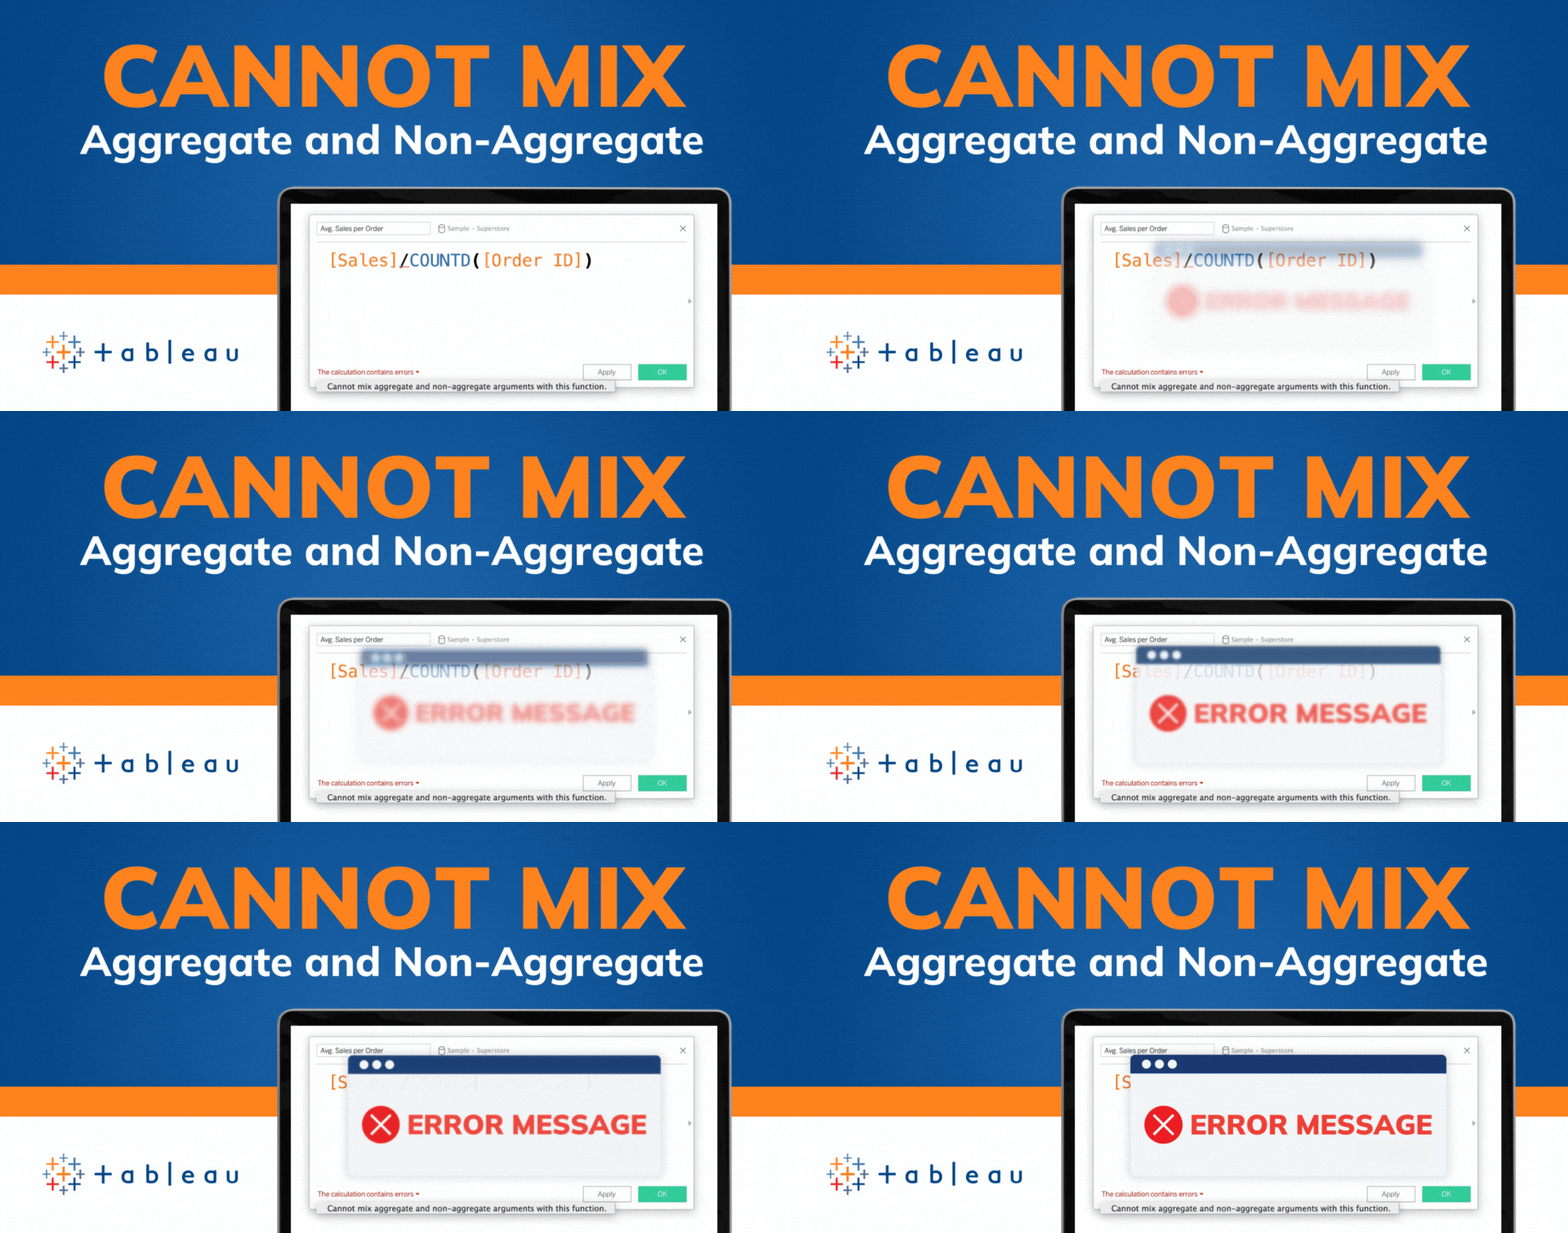
If you've spent any time working with Tableau, you've likely encountered the dreaded "Cannot Mix Aggregate and Non-Aggregate Arguments" error. It's a...