Tableau Conference 2025 | Know Before You Go
If you’re a data enthusiast, analytics professional, or just someone curious about Tableau’s latest innovations, the Tableau Conference 2025 is your...

As technology has made data increasingly accessible, data science continues to transform and shape how we think about problems across various industries. Nonprofits have a vast number of applications for predictive and prescriptive analytics as data flows from your CRM like donor profiles, operational data, social media, and more. Regardless of where your organization sits, data science can help you solve a number of problems. Today we will be taking a look at a few use cases for how nonprofits can utilize data science.
Effective marketing is a blend of the right message, at the right time, in the right channel. Failure on any part greatly reduces the chance of a conversion. Personalized marketing looks to create a personalized message for every possible customer. The message matters because different donors respond in different ways, some in terms of “if they will give” and others “how much they will give”. The right time matters. Is the donor currently able or willing to donate? If not, what can your nonprofit do to keep costs low and remain effective long term? Equally, the channel you message to the donor matters in their level of trust, interaction, and intent to act on the advertisement.
You can use data science across each of the three domains (message, time, and channel) to refocus marketing budgets and prioritize higher donation opportunities. Messaging can be refined using A/B testing to determine which advertisements see the highest lift in donations. Trends and forecasting can give you an indication of when campaigns should be prioritized. Again, A/B testing can tell you which channels for which potential clients are most likely to increase conversions.
Utilizing Data Science & AI to Personalize the Customer Journey: https://www.zineone.com/blogdetails/powerful-personalization/

It is important to capture data about past donors and prospective donors. You want to ensure you have data that reports when donors have given, how much they gave, which channel they donated through, estimates of wealth, non-giving activities (volunteerism, social media, etc), and more. This data allows you to begin grouping donors with similar prospective donors. For example, if you were to look at only two dimensions about donors, say wealth and propensity to give, you could easily see where natural groups of donors exist on a two-dimensional scatterplot. But when you want to include more variables about a donor such as volunteer hours, number of related social media posts, and more, then it becomes nearly impossible to visualize natural groups of donors. To find groups in high dimensions you can use clustering algorithms such as K-means, DBSCN, and agglomerative hierarchical clustering. These methods mathematically find groups of like donors and distinguish them from other groups. These groups can inform everything from marketing campaigns to donor acquisition to increased donor engagement.
Donor Analytics Crash Course: 5 Nonprofit Data Essentials: https://www.dnlomnimedia.com/blog/donor-analytics/
Many grants come contingent with meeting some measurable goal. Developing focused and actionable dashboards can greatly improve your ability to tell a compelling story of your mission, increase operational accountability, and monitor key trends in social behaviors in relationship to the health of your nonprofit. In reporting, dashboards give key stakeholders (board members, public, investors, etc.) the ability to understand the scope of impact through key performance indicators, monitoring trends, and responding appropriately. For example, in operations you can use dashboards to showcase food pantry inventory by location and use that information to find local donors and efficiently reduce the wait time for key food and health items. Additionally, you can use dashboards to monitor key social trends from Google Analytics on search patterns of donors or those in need.
Data Science for Nonprofits: https://www.discoverdatascience.org/social-good/nonprofits/

It can be especially difficult to monitor how your message is resonating with the masses via social media. There is a breadth of social media types ranging from Facebook & Twitter focusing on textual responses, to TikTok & Instagram dedicated to the power of images. Each social media channel plays a role in your portfolio of influence as you generate awareness and potential donors. Monitoring your effectiveness and health on these platforms, from traction to user responses, becomes difficult as it is hard to relate sentiment, involvement, and intent of messages in relation to the key activities your nonprofit is consciously striving to achieve.
Using Natural Language Processing (NLP) along with Sentiment Analysis Modeling allows you to reduce the clutter of a large volume of text. For example, we can look at one Instagram post from a new parent of an adopted pet, “Oscar … what are you doing!?! I can’t help but love this little guy #pet_adoption_center.” Now imagine analyzing thousands of posts like this- it would become near impossible to keep track of trends in people's sentiment toward your brand, let alone to find key opportunities early. Using NLP you can break posts into keywords/phrases and rate which parts of the post were generally positive. This makes it easier for you to visualize trends in word clouds, understand relationships between operations and/or revenue-generating activities, and open your ability to incorporate a wider degree of potential donor profiling.
Operations Research simply means utilizing mathematics and statistics to find the most efficient solutions to an operational problem. For example, the University of Chicago was tasked in identifying homes which may have used toxic lead paint in efforts to reduce lead poisoning of children in the city. With over 197 thousand homes built in a time when lead paint was prevalent, it would have taken the city over an estimated 76 years to inspect and remedy the homes. However, a majority of those homes have been repainted over the last 50 years. How can the city identify the most likely homes to focus the efforts of their inspectors in reducing risk of lead poisoning exposure to children? Using statistical models, the researchers were able to identify under 400 homes which were likely to contain lead paint due to socio, economic, and risk to exposure for children. This saved the city money in reducing inspection time on homes which no longer have lead paint or had low exposure risk to children. This enabled the city to achieve their goal in reducing lead poisoning cases for children.
Predictive Analytics to Prevent Lead Poisoning in Children: https://www.dssgfellowship.org/project/predictive-analytics-to-prevent-lead-poisoning-in-children/

Although this blog has reviewed a few high-level concepts and applications of data science in the nonprofit industry, the opportunities are limitless. The foundation of a good model is almost always grounded by a question.
If you have questions, there is a high possibility that data science can be used to help facilitate your business!
Data Science Case Studies in Nonprofit & Government: https://www.dssgfellowship.org/projects/
#DataTalk Podcast - Using Data Science to Help Nonprofit Organizations: https://www.experian.com/blogs/news/datatalk/nonprofit-datascience/
Data Science for the Environment: https://www.youtube.com/watch?v=ph439t-kTIE
Accelerate the Mission of Your Nonprofit: https://www.alteryx.com/why-alteryx/alteryx-for-good/non-profits
The 3 Types of Nonprofit Dashboards — and How to Build Each One: https://blog.techsoup.org/posts/he-3-types-of-nonprofit-dashboards-and-how-to-build-each-one
Donor Analytics Guide: 5 Answers to your Top Questions: https://www.donorsearch.net/donor-analytics/
Donor Analytics Crash Course: 5 Nonprofit Data Essentials: https://www.dnlomnimedia.com/blog/donor-analytics/
-2.gif)
If you’re a data enthusiast, analytics professional, or just someone curious about Tableau’s latest innovations, the Tableau Conference 2025 is your...

Tableau Plus is the new premium offering from Tableau, a leading data visualization and business intelligence platform. It builds upon the...

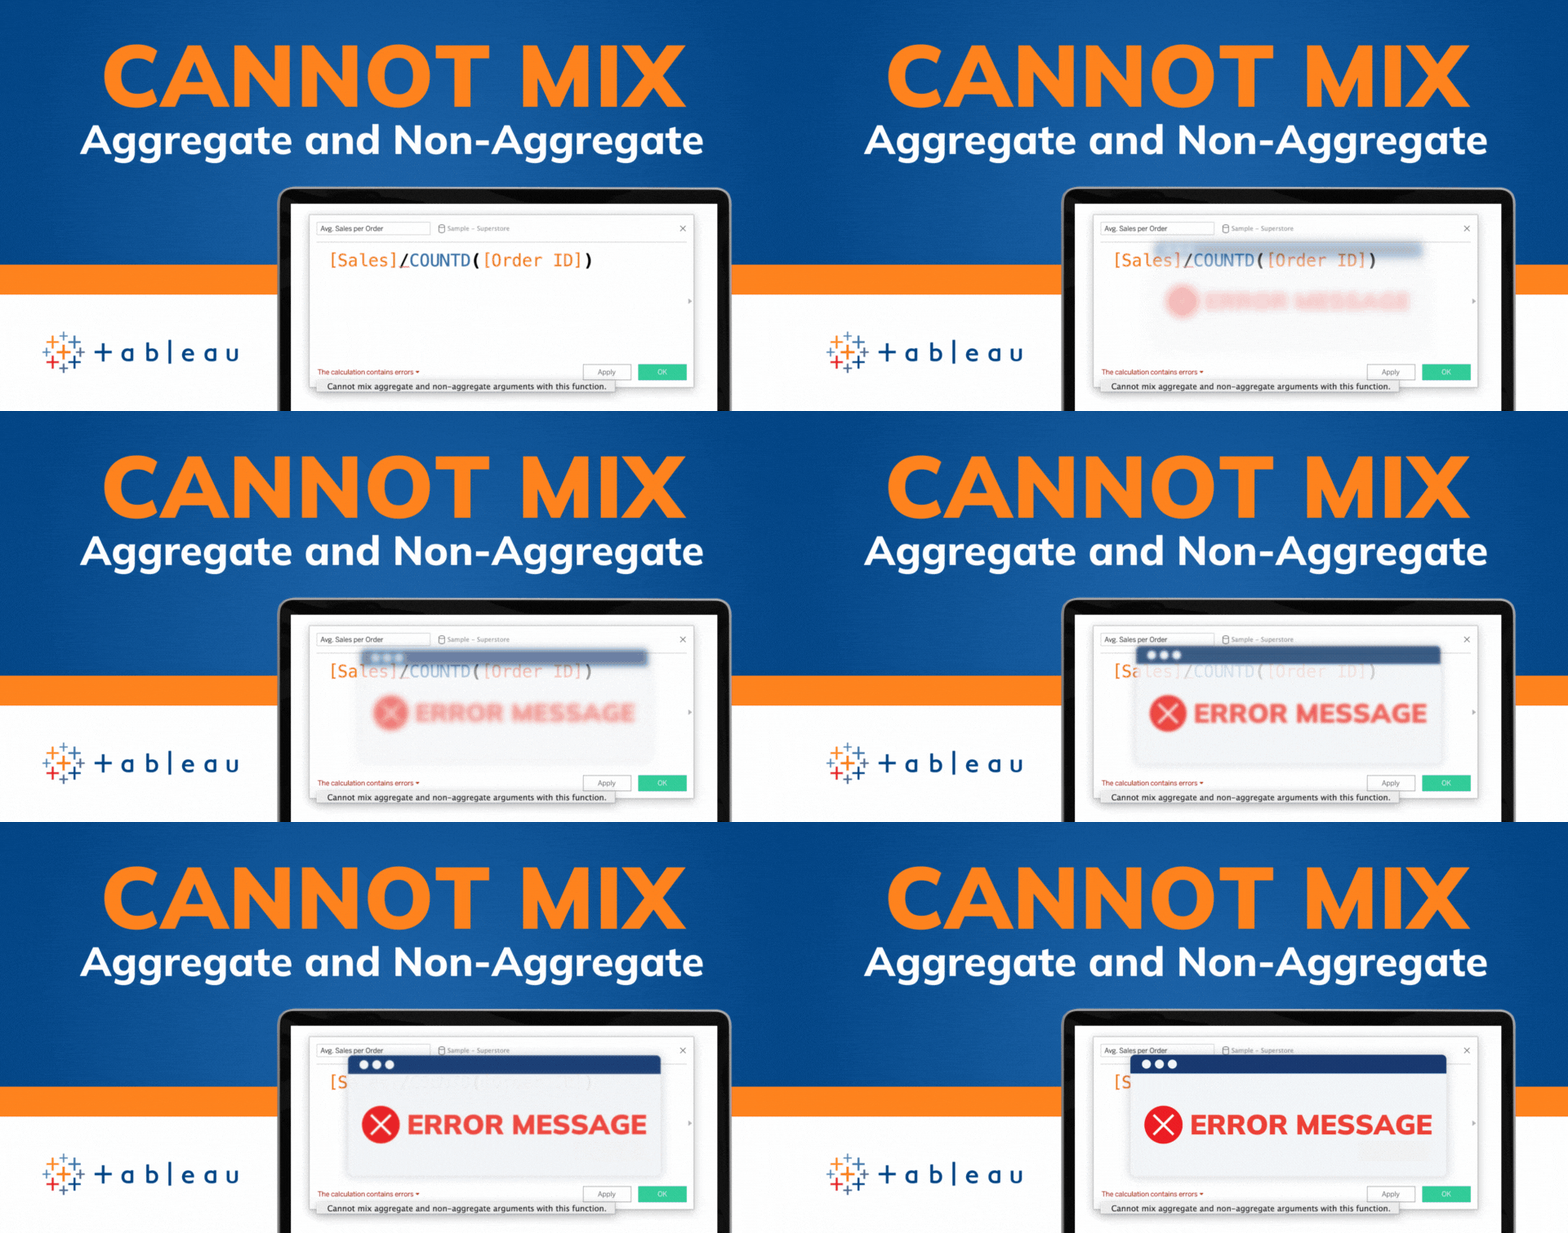
If you've spent any time working with Tableau, you've likely encountered the dreaded "Cannot Mix Aggregate and Non-Aggregate Arguments" error. It's a...