Tableau Conference 2025 | Know Before You Go
If you’re a data enthusiast, analytics professional, or just someone curious about Tableau’s latest innovations, the Tableau Conference 2025 is your...

Tableau is a powerful and intuitive data visualization software that has gained significant popularity in recent years. It allows users to quickly create visually appealing and interactive dashboards, reports, and charts using large datasets, making it an invaluable tool for business reporting and analysis. In this overview, we will explore the ins and outs, including key components, use cases, advantages, and how it compares to other popular tools like Excel and Microsoft Power BI.
Tableau offers a suite of products that cater to various aspects of data visualization and analysis, including
Tableau Desktop is the primary tool for creating interactive visualizations, reports, and dashboards. It provides a drag-and-drop interface that allows users to quickly create visually appealing charts and graphs without any coding knowledge. Users can connect to multiple sources, blend and clean data, and perform advanced business logic calculations with Tableau Desktop.
Tableau Desktop is the original flagship product of the Tableau suite and has largely spearheaded how data visualization tools have been built out today. It is designed with a non-technical business user in mind with the click-and-drag interface and is also capable of technically sophisticated visualizations and calculations to get exactly what you need from the product.
Tableau Server is an on-premise solution that allows organizations to host and manage their Tableau reporting environment. This provides control over security, integration, and customization while enabling users to access and collaborate on dashboards and reports through a web browser.
Tableau Server provides a lot of flexibility for organizations that want to take on the added management of hosting, infrastructure, and upgrades. While Server offers more robust options for integrating into existing IT infrastructure, large enterprises or organizations within heavily regulated environments tend to choose Tableau Server.
Tableau Cloud, formerly known as Tableau Online, is a fully-hosted, cloud-based solution that enables organizations to access and analyze data without the need for on-premises infrastructure. It offers similar functionality to Server but eliminates the need for organizations to manage their own infrastructure. Cloud is an easy plug-and-play solution for organizations of all sizes without the added overhead of administration.
With Tableau's acquisition by Salesforce in 2019, there is an increasing focus on innovation and messaging for customers to move to Tableau Cloud - as Salesforce has the entirety of their ecosystem based in cloud applications as well. Tableau Online was renamed to match Salesforce's broader cloud naming convention.
Tableau's Public Cloud is a free platform for sharing, exploring and discovering interactive data visualizations created by users worldwide. It is an excellent resource for learning and inspiration, as well as showcasing one's data visualization skills to a broad audience. Viz-of-the-Day on Tableau Public is a great showcase to see what's possible when creating visualizations - just be mindful of publishing any content, as the data will be publicly accessible.
Tableau Prep is a data preparation tool that helps users clean, combine, and reshape data before visualizing. It offers an intuitive, visual interface for performing common data preparation tasks like filtering, aggregating, data type conversions, and merging data sources. Tableau's Prep's focus is mainly built for business users as no SQL knowledge is required. While it has the ability to handle complex data structures and cleansing operations, Prep is not intended as an enterprise-grade ETL (extract, transform, load) solution at scale.
Data Management is an add-on that helps organizations ensure their data is accurate, up-to-date, and easily accessible. It includes features for data source cataloging, data quality checks, and automated data updates for Prep workflows. This can be an incredibly valuable add-on for organizations looking to organize content better, understand source lineage (where data is being pulled from), and be able to schedule Prep flows to run without human intervention.
Tableau Reader is a free desktop application that allows users to interact with dashboards created by others - at the expense of version control, content security, and accessibility that comes with Cloud and Server deployments.
Tableau also provides natural language search capabilities within Server and Cloud to let users type questions in common language and get visualizations to inform action. The visualized answers presented are created automatically without necessarily understanding the nuances of underlying sources.
Tableau is primarily used for:
Although Excel is a widely-used spreadsheet application, Tableau offers several advantages when it comes to visualization and analysis:
Tableau Data Analysis Advantages
Ease of use: Tableau's drag-and-drop interface allows users to create complex visualizations quickly and easily, even without coding knowledge.
Interactive visualizations: Tableau enables users to create interactive, dynamic visualizations that can be explored and manipulated by end-users.
Scalability: Tableau can handle large datasets more efficiently than Excel, making it a better choice for working with big data.
Collaboration: Server and Cloud facilitate collaboration, allowing teams to work together on dashboards and reports.
Static visualizations: Excel produces static charts and graphs, which lack the interactivity and dynamism of Tableau visualizations.
Limited scalability: Excel struggles with large datasets, leading to slow performance and limited analytical capabilities.
Less intuitive for visuals: Creating complex visualizations in Excel often requires advanced knowledge of formulas and chart customization, making it less accessible for non-technical users.
Collaboration challenges: Excel files need to be shared manually, increasing the risk of version control issues and making real-time collaboration difficult.
Tableau is both a tool and a software suite. As a tool, it enables users to create visualizations, dashboards, and reports that can be accessed from a browser or mobile phone. As a software suite, it encompasses a range of interconnected products, including Tableau Desktop, Server, Cloud, Public, Prep, and Data Management, and Reader.
Tableau is designed to be user-friendly, with a drag-and-drop interface that makes it accessible to users without coding experience. However, like any software, there is a learning curve involved. The difficulty of learning Tableau depends on the user's familiarity with analytics concepts, as well as their willingness to both explore data, and experiment with the software.
No, Tableau does not require coding knowledge to create visualizations or perform basic data analysis. However, users with coding skills (e.g., SQL, R, or Python) can leverage their expertise to perform more advanced calculations and transformations.
While SQL is not required to use, having SQL knowledge can enhance the user's ability to work with data. Users can write custom SQL queries to filter, join, or aggregate data before visualizing. Additionally, Tableau supports integrating with various SQL databases, spreadsheets, and cloud apps like Google Analytics, allowing users to connect to and analyze data stored in these databases directly.
One of the best parts of Tableau Software is the passionate community that creates a ton of great content, active forums, and ongoing learning opportunities. For starters, Tableau's free training videos, video tutorials, and educational webinars are a great spot to get started with bite-sized content - it's how I started back in 2012.
There are several quality paid learning subscriptions through both popular content platforms (Coursera, Udemy, LinkedIn Learning) as well as customized classroom training packages delivered by consulting partners like DataDrive.
For technical support, the Tableau forums are filled to the brim with questions to almost every question you can imagine if you find yourself stuck on an error or specific concept. I recommend for new users to take a look at the following two Tableau Public community initiatives.
Lastly, there is the vibrant community that often identifies as #DataFam. Annually, Tableau recognizes Ambassadors and Visionaries, individuals who have contributed to the community above and beyond regarding education, content, and socializing of the tool.
Tableau's popularity can be attributed to several factors:
The best part of Tableau is that use cases exist across all industries for seeing and understanding data.
Sales & Marketing - Analyze customer activity, track sales performance, and stay ahead of market trends
Finance - Monitor financial performance, analyze budgets (and what-if scenarios), and forecast revenue
Operations - Tracking internal KPIs, optimize supply chain and workforce processes
Human Resources - Find trends within demographic and employee statistics around turnover, retention, recruitment, and management performance
Although Tableau excels in many areas, it may not be the best choice for certain tasks:
Advanced statistical analysis - Tableau is not designed to perform complex statistical tests or modeling over large data sets, but users do have the ability to directly integrate languages like R or Python for cleansing and statistical steps.
Storage and management - Tableau is not a database management system and is not intended for storing or managing large data volumes. The software has the ability to connect and extract (or snapshot) data from various sources, but this should not be seen or used as a replacement to a robust data warehouse.
Real-time processing - While Tableau can handle near-real-time data, it is not the best choice for processing streaming data in real-time use cases. It's best practice to clarify the needs of your end users to confirm the requirement of real-time visibility. 'Near real-time' is likely more than enough.
Blast crosstab reporting - Tableau has the ability to build robust crosstab tables for analyzing row-level details within data sets, but Tableau is a data analytics and visualization tool first. This means that large spreadsheet views can take longer to render vs. a spreadsheet-based technology like Microsoft Excel.
Tableau Software continues to be in high demand due to the growing importance of visualization and analytics in business intelligence. Tableau's ease of use, powerful analytics capabilities, and integration with various sources make it a popular choice for organizations across industries. As the need for insights increases, demand for skills is expected to remain strong.
While both Tableau and Microsoft Power BI are popular visualization and business intelligence tools, they have some differences:
Ultimately, the choice between Tableau and Power BI depends on the specific needs, budget, and existing infrastructure of the organization.
Tableau is a powerful and versatile visualization and business intelligence tool that enables users to transform raw data into actionable insights. With its user-friendly interface and extensive features, this self-service analytics suite has become a popular choice for organizations across industries.
When considering Tableau as a data analytics tool for your organization, it is essential to evaluate its capabilities in relation to your specific needs and requirements. It's smart to compare against other popular analytics tools to make the decision about the best data visualization solution for your organization - and the true cost of ownership beyond the license pricing.
Our experienced DataDrive team can attest that Tableau unlocks incredible data-driven results when deployed correctly. By understanding its strengths and limitations, you can determine if Tableau is the right choice for your organization and make the most of its capabilities.
DataDrive is recognized as a Premier Tableau Partner (and Partner of the Year in 2022) for supporting organizations of all sizes with implementation, development, and ongoing support. Reach out today to take your insights to new heights!
What is the Tableau used for?
Tableau is a powerful visualization and analysis platform that helps people and organizations see, understand, and take action with data. Organizations use Tableau to make analytics reveal patterns, identify outliers, measure and track metrics to help make disparate, messy data more understandable for all users - technical and non-technical.
What is Tableau in simple terms?
Tableau is a visual self-service analytics platform that helps people see, understand, and take action with data to inform and solve business problems.
-2.gif)
If you’re a data enthusiast, analytics professional, or just someone curious about Tableau’s latest innovations, the Tableau Conference 2025 is your...

Tableau Plus is the new premium offering from Tableau, a leading data visualization and business intelligence platform. It builds upon the...

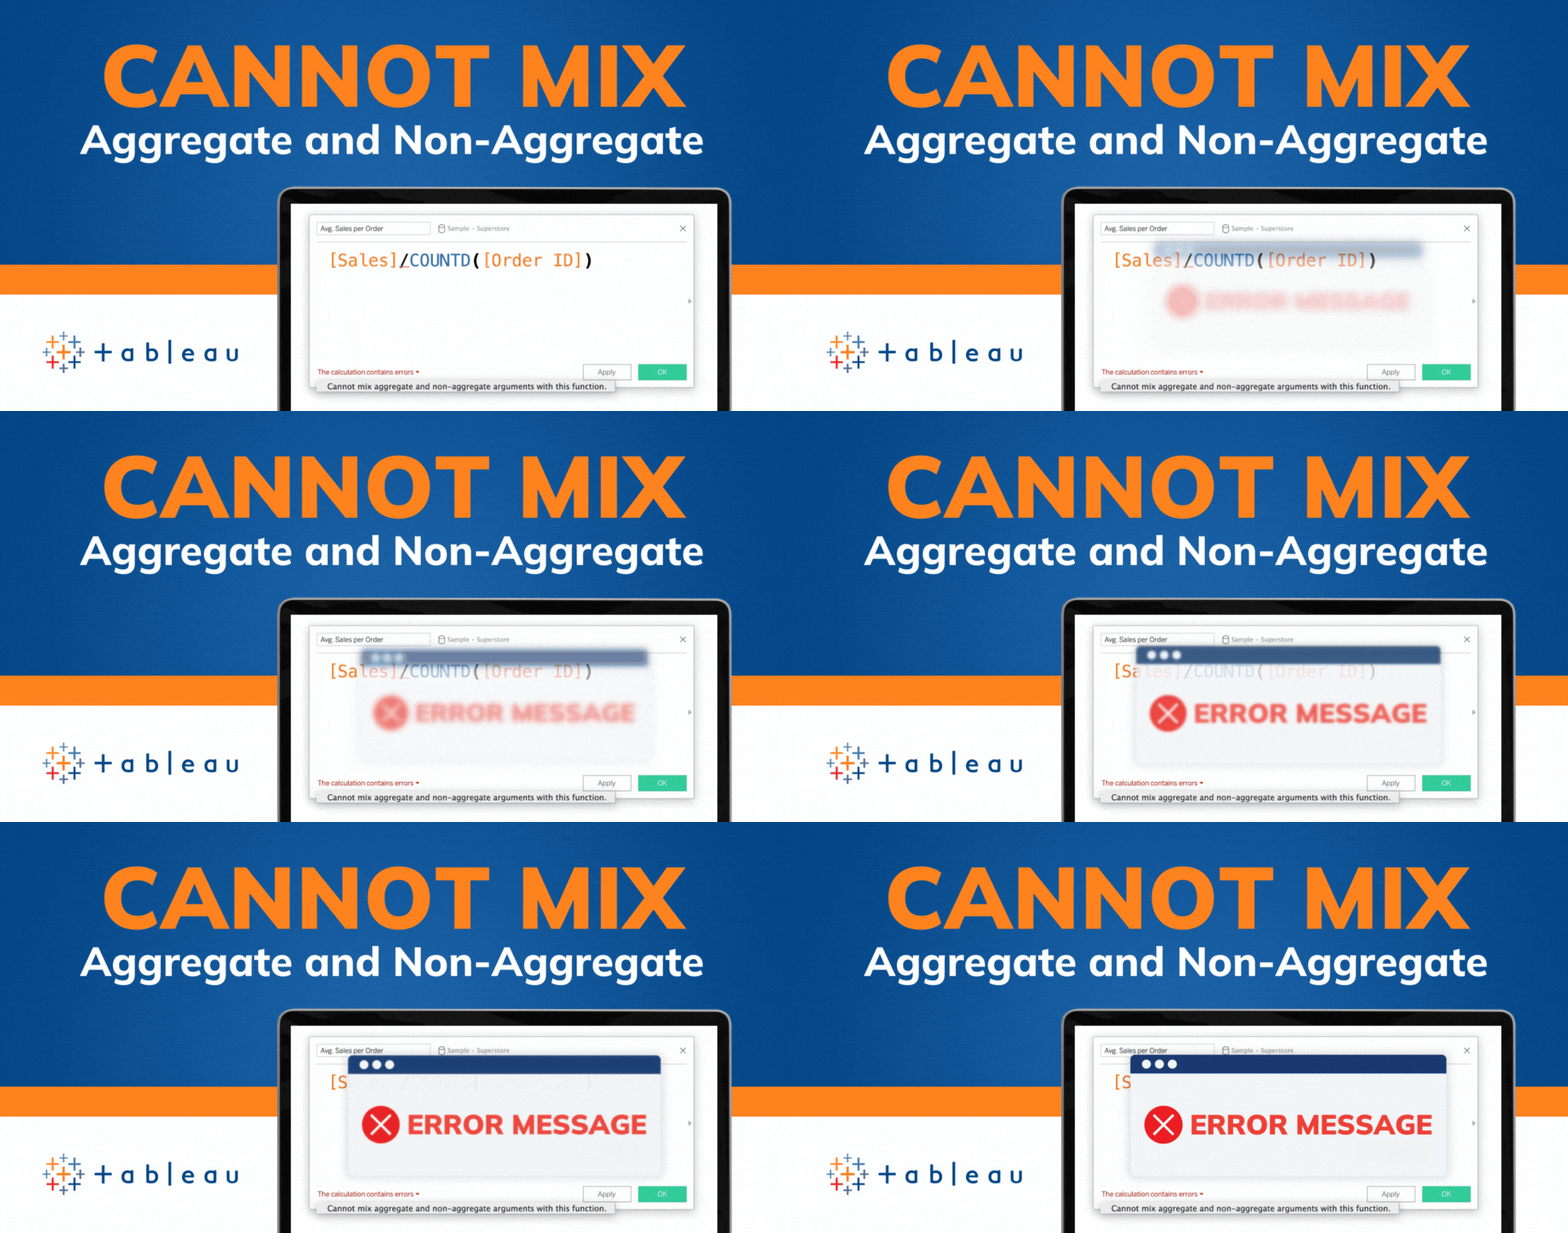
If you've spent any time working with Tableau, you've likely encountered the dreaded "Cannot Mix Aggregate and Non-Aggregate Arguments" error. It's a...