Tableau Conference 2025 | Know Before You Go
If you’re a data enthusiast, analytics professional, or just someone curious about Tableau’s latest innovations, the Tableau Conference 2025 is your...

As an Analytics Consultant, it’s my responsibility to leverage Tableau and other tools to develop solutions for our clients. In mid-June, I had the opportunity to sit for and pass the Tableau Desktop Certified Associate certification exam. #CertifiablyTableau
While my Tableau user story started a few years ago, my certification journey took only 90 days.
Several years ago I was working as a contractor for a healthcare client. During that engagement, I became somewhat familiar with Tableau. At that time, I had Microsoft Excel experience, but my background in data visualization was limited. I was well-versed with the simple default Excel charts and graphs. But when I started in Tableau, I felt completely lost. I struggled to understand how to build visualizations or how to present the data I was looking for.
After a year stumbling in the dark with Tableau, I transitioned to a different company. I joined an incredible team of analysts who worked only with Microsoft Power BI. I did my best to quickly learn the tools, and developed a workable understanding of DAX. This experience taught me how to successfully communicate data with dashboards. After a year of working with that team, DataDrive’s founder, Luke Komiskey reached out to me to reconnect.
When Luke and I sat down for coffee, I learned the story of DataDrive and about their Partner relationship with Tableau. Two takeaways from that conversation resonated with me:
As a part of the interview process, Luke issued me a challenge:
Using the Superstore dataset, develop a helpful dashboard that an executive could use to understand what’s going on.
I had little time to craft a solution, yet I used several of the concepts I learned working with Power BI and limped into the interview with a functional Tableau dashboard.
I presented my dashboard, received an offer, and recognized that my level of competency needed to improve. In order for me to be able to deliver exceptional value to our clients, I needed to grow. That’s when I made the decision to study up and pursue a certification.
Before joining the DataDrive team, I was not comfortable working with Tableau. Looking back, there were two types of software tools that helped me rapidly skill up. These tools helped me learn core concepts Tableau uses, which meant that I had fewer important things to learn from scratch. These tools fall into two buckets: ETL/SQL-based tools and reporting/data visualization tools.
ETL and SQL-based software tools that helped me learn Tableau quickly were Alteryx Designer, and other ETL tools that used SQL. These tools included Teradata Studio, SAS Enterprise Guide, and Microsoft SQL Server Management Studio. These tools helped me understand how to structure data in a way that visualizations could be more easily built.
The reporting and data visualization tools that helped me learn Tableau were Microsoft Excel, Microsoft Power BI, SAP Business Objects, and Crystal Reports. These tools taught me how to pull data into a data visualization platform and achieve a desired outcome. These tools taught me the most common types of user interactivity, and how business owners like their data presented.
A Google search for “Learn Tableau” returns more than 100 million results. Needless to say, there are many resources available to help a newer user learn the tool. The most common resources I have seen include online courses (Tableau’s eLearning, Udemy, Coursera), books and blogs, and YouTube tutorial videos.
When it came to choosing my training path, I focused on Tableau’s eLearning platform and read several books. I chose to buy an annual subscription to Tableau’s eLearning platform. While I almost balked at the annual cost of $120, this resource was a complete game changer! Their training was hands on, clearly taught the concepts, and provided experience using the tool.
After 50 hours in their program, I completed all three training levels: Fundamentals, Intermediate, and Advanced. Tableau also provides a variety of learning paths tailored to specific roles. Several examples include Consumer, Author, Analyst, Data Scientist, Developer, and Server Architect.
I purchased a few books about Tableau and data visualization to understand industry best practices. Several of my favorites include:
I completed the Tableau eLearning material, and read through several of those books. I worked in Tableau almost every day for about 2 months. I finally took the leap and signed up to take the Certified Associate certification exam.
I gave myself about two weeks to review my training materials, and prepare with Tableau’s study guide. Several of my colleagues recommended practice quizzes (for free) and exams (for sale) through the Learning Tableau website. While I did not buy the practice exams, the study guide and the practice quizzes were helpful in understanding questions I would face. They also revealed a few weak spots I needed to review.
While I had prepared diligently, when my certification exam day came, I was nervous. I logged onto my exam portal, connected with my proctor, and got started. There were a few questions that I had to flag and return to. About an hour after I started, I submitted my exam and awaited to see my results. I passed with flying colors!
Looking back at the past 90 days, it’s remarkable how much I learned in such a short amount of time. If I could do it all over again, I wouldn’t have drawn it out to 90 days. I would have condensed my learning and review time and would have tested much sooner.
I recommend adding a Tableau certification to your resume. Even if you have never used Tableau, data visualization is a highly-marketable skill. This experience taught me an immense amount of information. Not only about Tableau, but how to effectively answer business questions and learn to ask good questions.
-2.gif)
If you’re a data enthusiast, analytics professional, or just someone curious about Tableau’s latest innovations, the Tableau Conference 2025 is your...

Tableau Plus is the new premium offering from Tableau, a leading data visualization and business intelligence platform. It builds upon the...

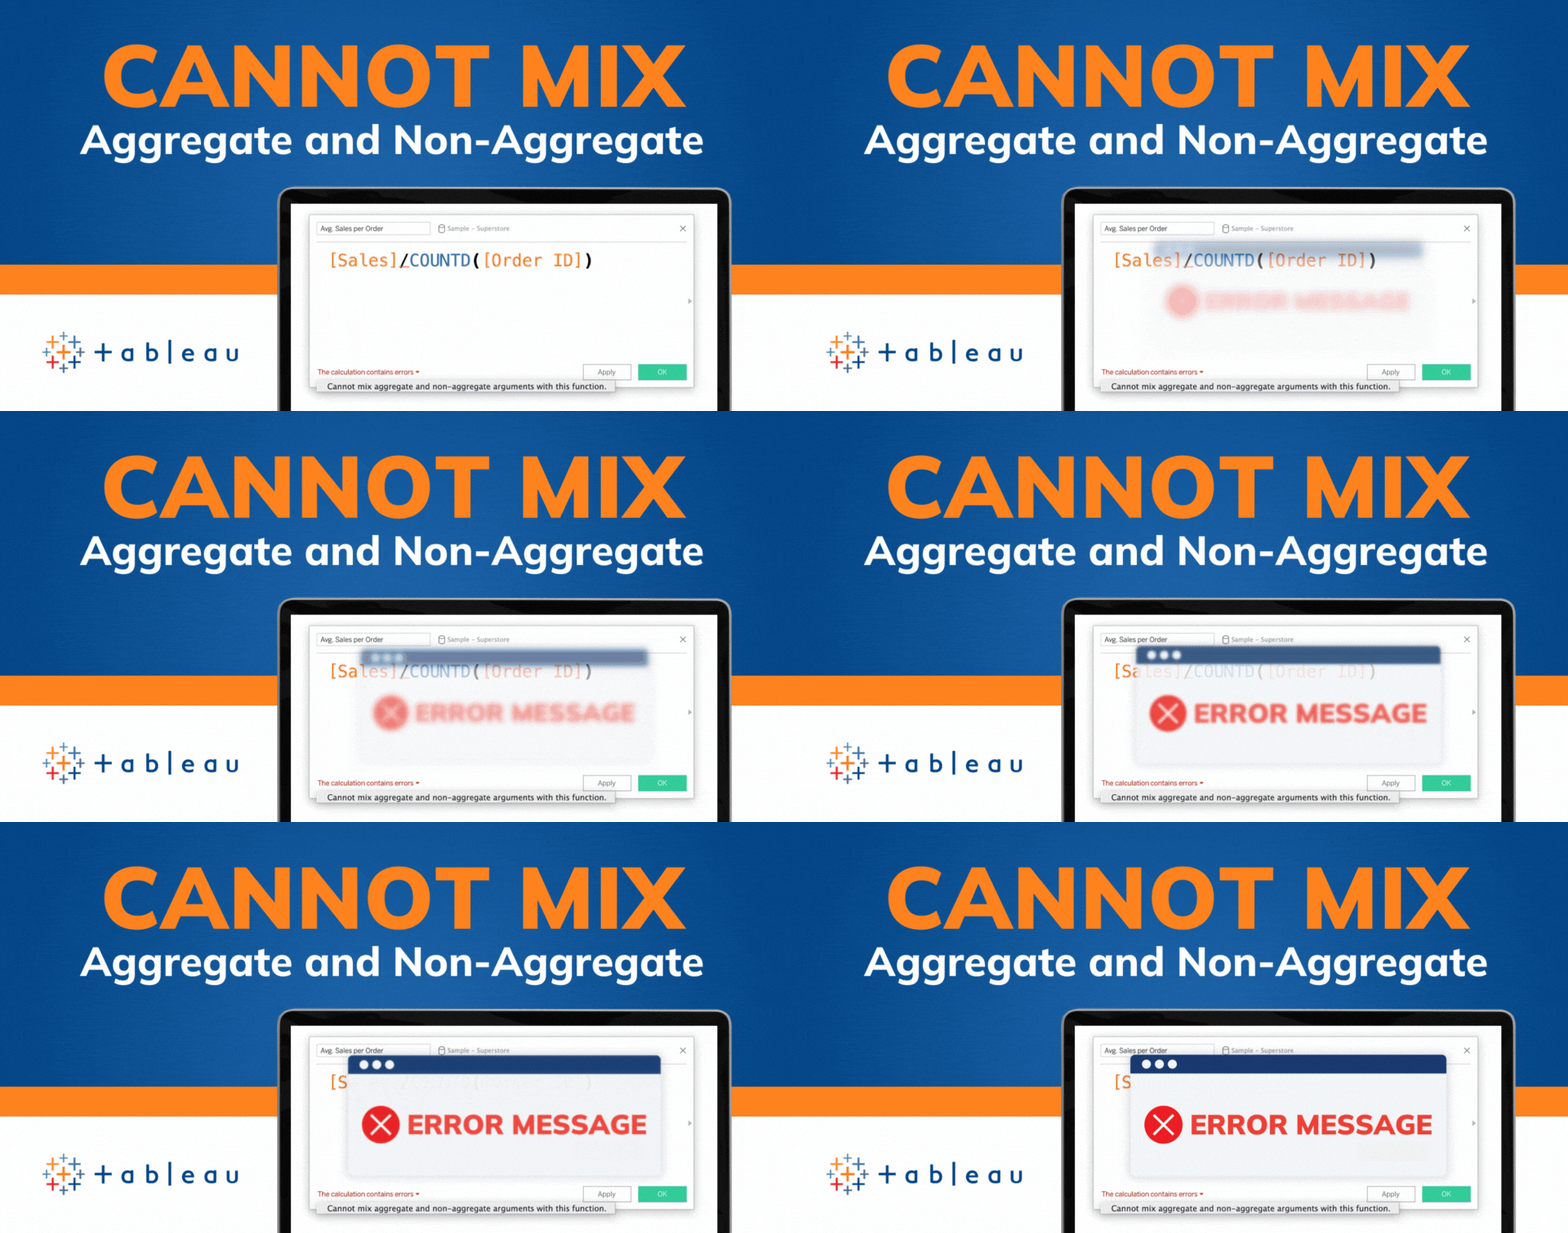
If you've spent any time working with Tableau, you've likely encountered the dreaded "Cannot Mix Aggregate and Non-Aggregate Arguments" error. It's a...