Kaela Dickens

I’m Kaela, an Analytics Consultant at DataDrive. I fell in love with Tableau after years of working in GIS (spatial data is still my favorite) and management in the public sector. To me, data viz is the intersection of people, data, and art - my perfect trifecta - and I feel lucky to get to help people understand their world in new ways through data visualization. If you see me out in the world, come get a high five!

How to QA Tough Calculated Fields (Without Pulling Your Hair Out)

It’s tempting to try and solve calculation problems on the fly in your visualizations. Just slap down few calculated fields, throw them in your viz, and it’ll all tie out perfectly, right? Ha. More than once I’ve found myself pounding out changes to...

Read More

6 Questions to Help You Answer: Should I Go into Analytics Consulting?

Whether you're just starting out in the analytics field or are considering a change, it can be...

Read More

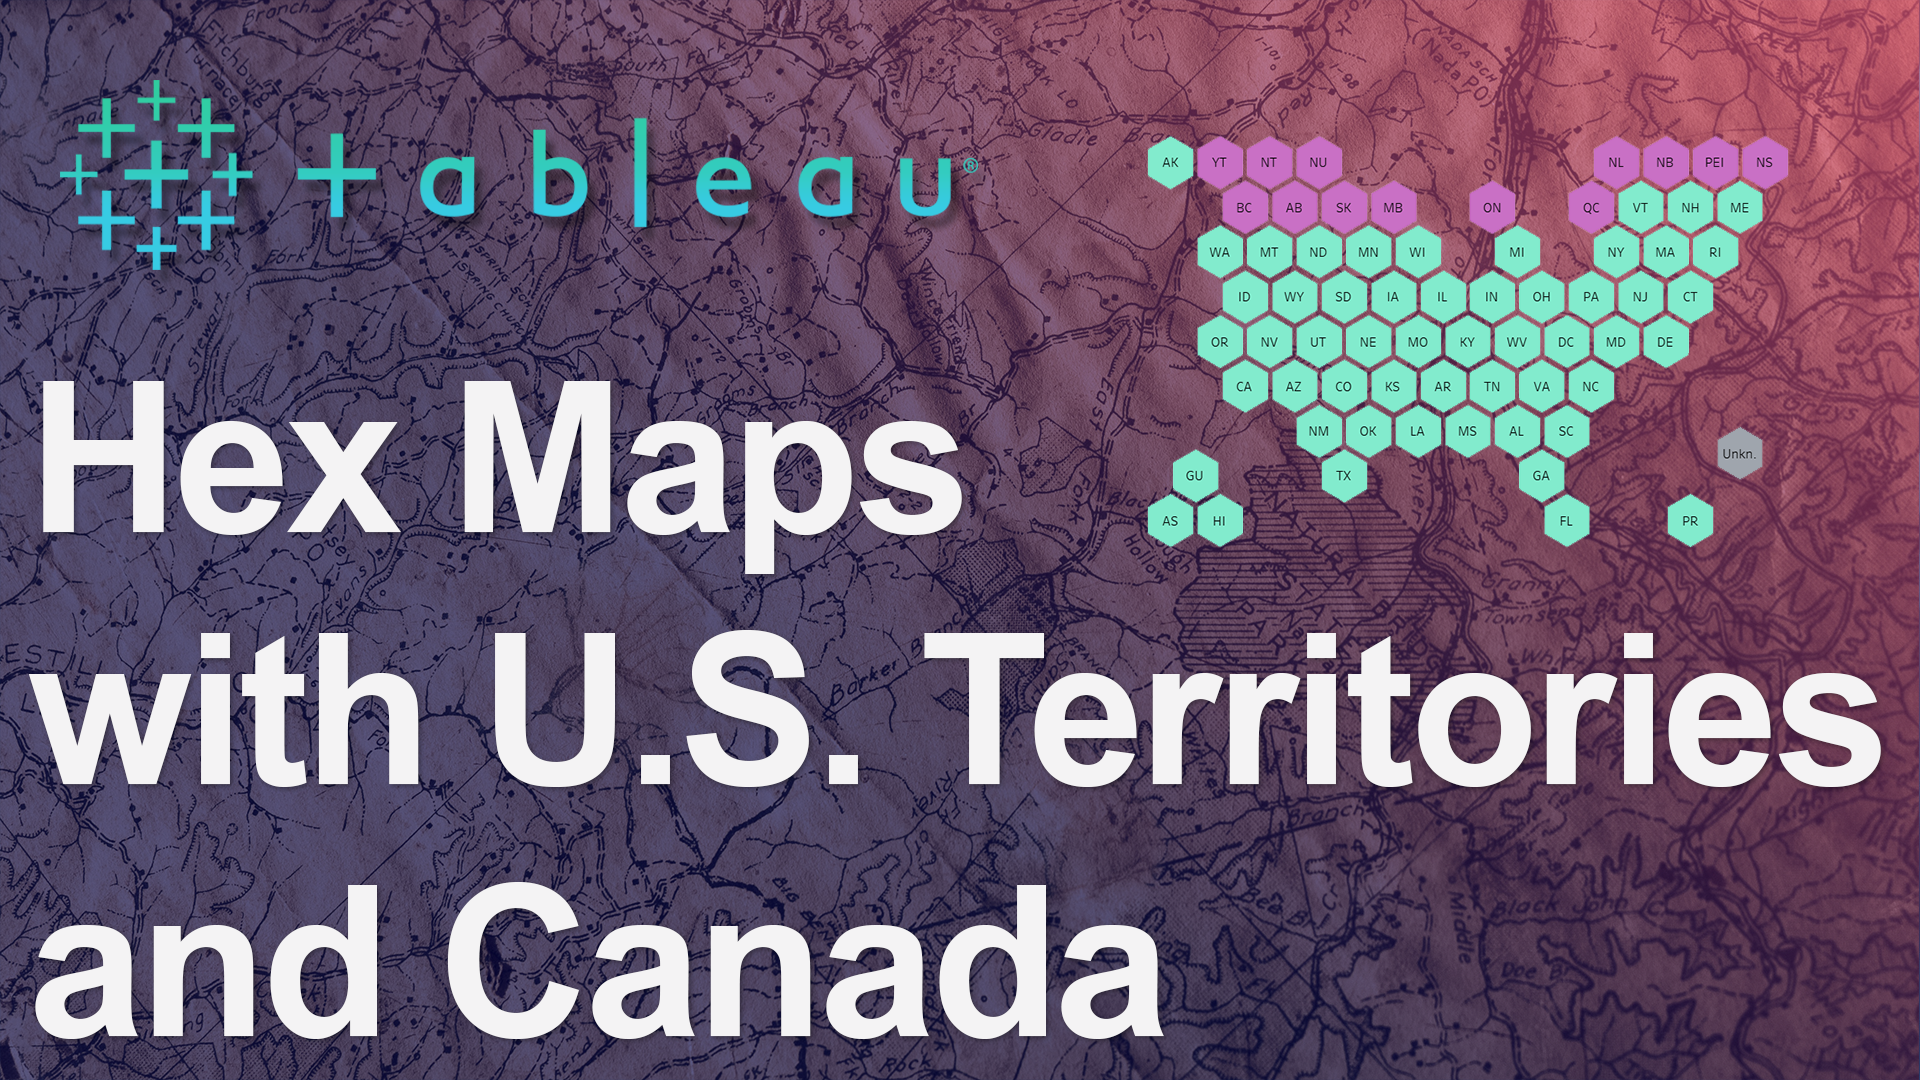
Hex Maps for Tableau: US, Territories, & Canada

Web maps are tricky. Let's say you are using a dataset to compare sales across states and provinces...

Read More