

 Kaela Dickens


Tableau Conference 2025 | Know Before You Go
If you’re a data enthusiast, analytics professional, or just someone curious about Tableau’s latest innovations, the Tableau Conference 2025 is your...
Web maps are tricky. Let's say you are using a dataset to compare sales across states and provinces in the US and Canada. In a web map, you can't see most of the east coast without zooming in. (If you can’t see Connecticut, does it exist?)
Tableau’s default Web Mercator map
You also miss out on Puerto Rico, American Samoa, Alaska, and Hawaii unless you make inset maps, which can be finicky and clunky. Furthermore, the standard Web Mercator map projection (a method of putting the spherical earth onto a flat surface, like a computer screen) makes Alaska and northern Canada look ENORMOUS, so the focus of the map is incredibly skewed. (Thank you West Wing for your perfect illustration.)
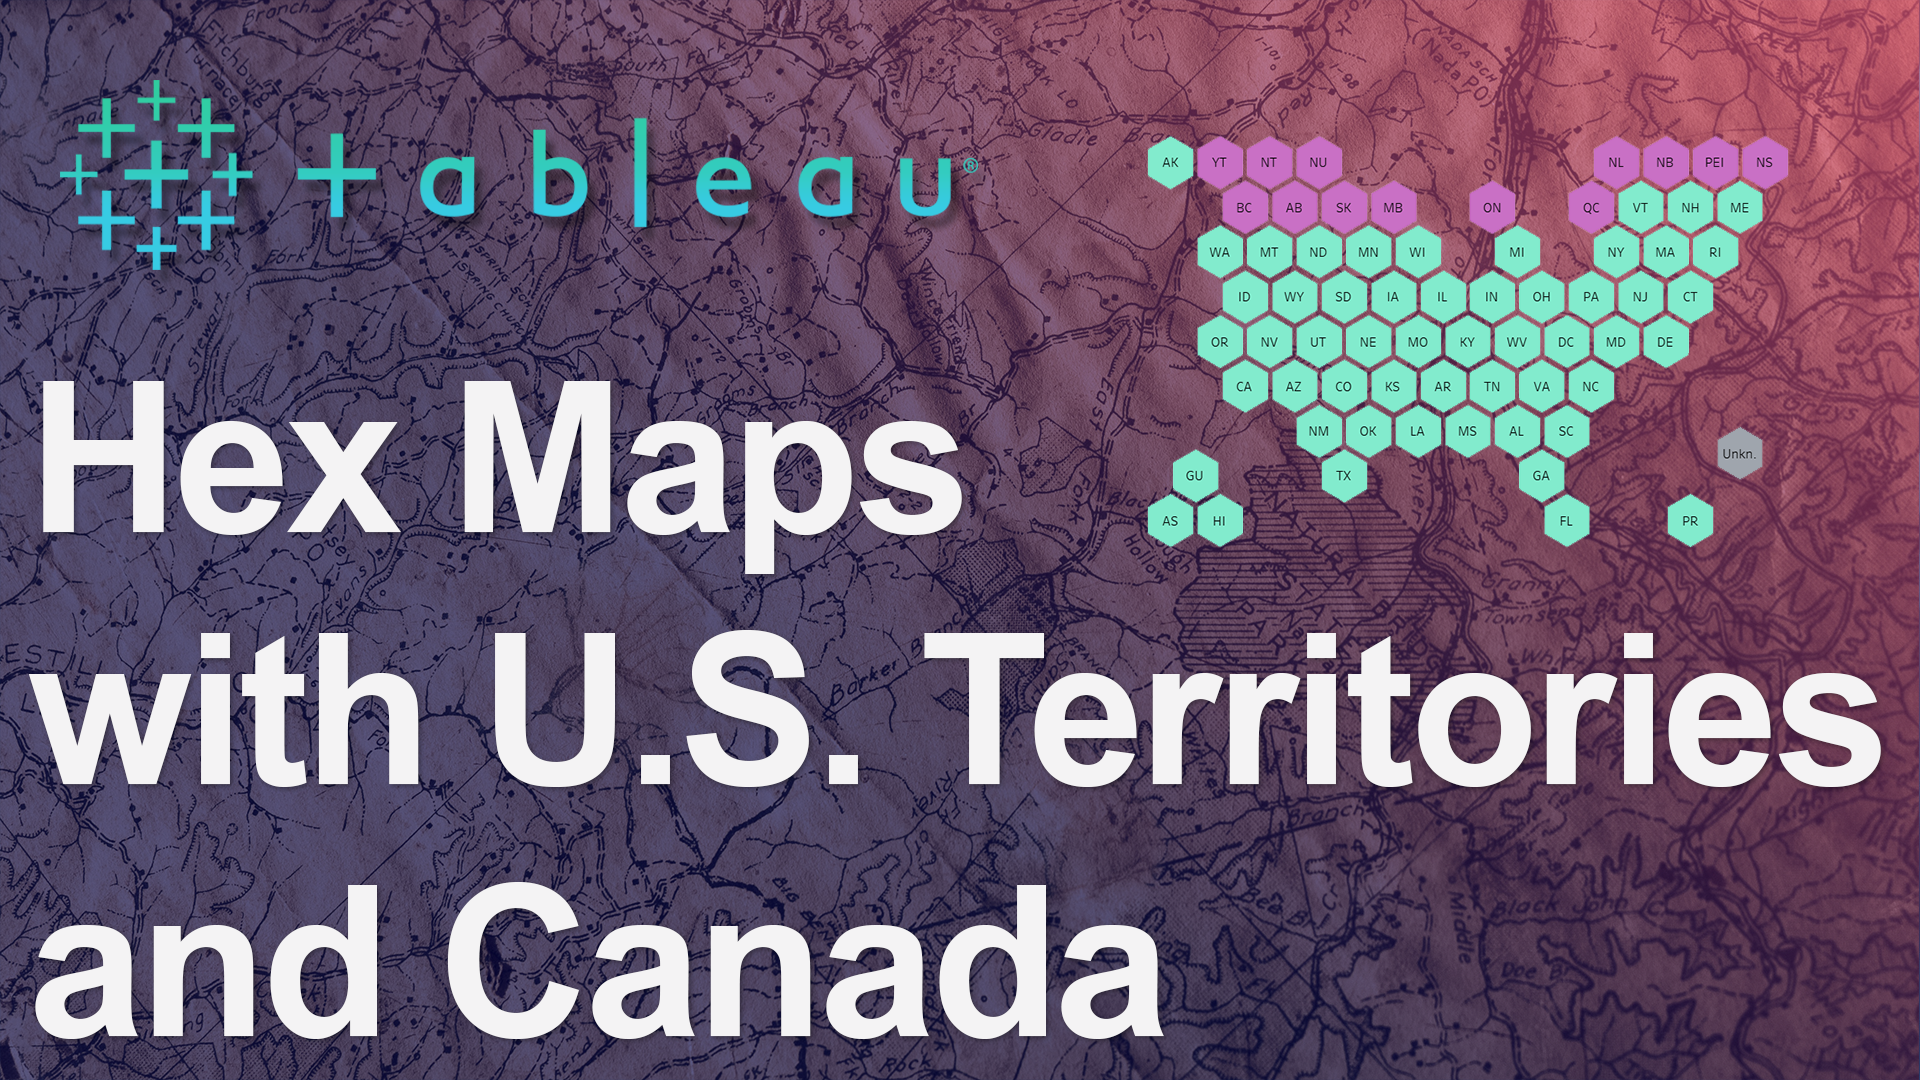
The most commonly accepted alternative is to use a hex map instead of a geographic map. Hex maps are tiled maps, which use geometry instead of geography to depict the features, making it much more flexible to fit things on one screen and keep an even focus.
Hex map published by Sir Viz a Lot: https://www.sirvizalot.com/2015/11/hex-tile-maps-in-tableau.html
Hex maps are perfect when:
There are plenty of hex map templates out there, but most just have the 50 United States + Puerto Rico and Washington DC. For a client project, I needed not only US states, but US territories and Canadian provinces as well. I used Tessellation’s great blog post as a base for adding the hex map elements straight into my dataset. (Thank you, Tessellation!)
For my client’s case, I made a few swaps among the existing states, added the territories and Canadian provinces, and added an “Unknown” spot for any pesky non-conforming or Null states.
After building the framework for a US states, territories, and Canadian provinces by hand, I wanted to save others the trouble and share the resource widely!
To complete your hex map, you'll need a ‘state/province’ field from your original dataset. You’ll also need to create a calculated ‘row’ field, and ‘column’ field.
If the State/Province names in your dataset are fully written out, you can skip this step. If they are abbreviated, create a "State/Province (Long)" calculated field. This will create long names for your abbreviated places, AND dump any Nulls or Unknowns into an “Unknown” spot.
CASE [Your Abbreviated State/Province Field]
WHEN 'AL' THEN 'Alabama'
WHEN 'AK' THEN 'Alaska'
WHEN 'AZ' THEN 'Arizona'
WHEN 'AR' THEN 'Arkansas'
WHEN 'AS' THEN 'American Samoa'
WHEN 'CA' THEN 'California'
WHEN 'CO' THEN 'Colorado'
WHEN 'CT' THEN 'Connecticut'
WHEN 'DE' THEN 'Delaware'
WHEN 'DC' THEN 'District of Columbia'
WHEN 'FL' THEN 'Florida'
WHEN 'GA' THEN 'Georgia'
WHEN 'GU' THEN 'Guam'
WHEN 'HI' THEN 'Hawaii'
WHEN 'ID' THEN 'Idaho'
WHEN 'IL' THEN 'Illinois'
WHEN 'IN' THEN 'Indiana'
WHEN 'IA' THEN 'Iowa'
WHEN 'KS' THEN 'Kansas'
WHEN 'KY' THEN 'Kentucky'
WHEN 'LA' THEN 'Louisiana'
WHEN 'ME' THEN 'Maine'
WHEN 'MD' THEN 'Maryland'
WHEN 'MA' THEN 'Massachusetts'
WHEN 'MI' THEN 'Michigan'
WHEN 'MN' THEN 'Minnesota'
WHEN 'MS' THEN 'Mississippi'
WHEN 'MO' THEN 'Missouri'
WHEN 'MT' THEN 'Montana'
WHEN 'NE' THEN 'Nebraska'
WHEN 'NV' THEN 'Nevada'
WHEN 'NH' THEN 'New Hampshire'
WHEN 'NJ' THEN 'New Jersey'
WHEN 'NM' THEN 'New Mexico'
WHEN 'NY' THEN 'New York'
WHEN 'NC' THEN 'North Carolina'
WHEN 'ND' THEN 'North Dakota'
WHEN 'OH' THEN 'Ohio'
WHEN 'OK' THEN 'Oklahoma'
WHEN 'OR' THEN 'Oregon'
WHEN 'PA' THEN 'Pennsylvania'
WHEN 'PR' THEN 'Puerto Rico'
WHEN 'RI' THEN 'Rhode Island'
WHEN 'SC' THEN 'South Carolina'
WHEN 'SD' THEN 'South Dakota'
WHEN 'TN' THEN 'Tennessee'
WHEN 'TX' THEN 'Texas'
WHEN 'UT' THEN 'Utah'
WHEN 'VT' THEN 'Vermont'
WHEN 'VA' THEN 'Virginia'
WHEN 'WA' THEN 'Washington'
WHEN 'WV' THEN 'West Virginia'
WHEN 'WI' THEN 'Wisconsin'
WHEN 'WY' THEN 'Wyoming'
WHEN 'YT' THEN 'Yukon'
WHEN 'NT' THEN 'Northwest Territories'
WHEN 'NU' THEN 'Nanavut'
WHEN 'NL' THEN 'Newfoundland & Labrador'
WHEN 'BC' THEN 'British Columbia'
WHEN 'AB' THEN 'Alberta'
WHEN 'SK' THEN 'Saskatchewan'
WHEN 'MB' THEN 'Manitoba'
WHEN 'ON' THEN 'Ontario'
WHEN 'PEI' THEN 'Prince Edward Island'
WHEN 'QC' THEN 'Quebec'
WHEN 'NB' THEN 'New Brunswick'
WHEN 'NS' THEN 'Nova Scotia'
ELSE 'Unknown'
END
CASE [Your Long State/Province Field]
WHEN 'Alabama' THEN -6
WHEN 'Alaska' THEN -0
WHEN 'American Samoa' THEN -8
WHEN 'Arizona' THEN -5
WHEN 'Arkansas' THEN -5
WHEN 'California' THEN -5
WHEN 'Colorado' THEN -5
WHEN 'Connecticut' THEN -3
WHEN 'Delaware' THEN -4
WHEN 'District of Columbia' THEN -4
WHEN 'Florida' THEN -8
WHEN 'Georgia' THEN -7
WHEN 'Guam' THEN -7
WHEN 'Hawaii' THEN -8
WHEN 'Idaho' THEN -3
WHEN 'Illinois' THEN -3
WHEN 'Indiana' THEN -3
WHEN 'Iowa' THEN -3
WHEN 'Kansas' THEN -5
WHEN 'Kentucky' THEN -4
WHEN 'Louisiana' THEN -6
WHEN 'Maine' THEN -1
WHEN 'Maryland' THEN -4
WHEN 'Massachusetts' THEN -2
WHEN 'Michigan' THEN -2
WHEN 'Minnesota' THEN -2
WHEN 'Mississippi' THEN -6
WHEN 'Missouri' THEN -4
WHEN 'Montana' THEN -2
WHEN 'Nebraska' THEN -4
WHEN 'Nevada' THEN -4
WHEN 'New Hampshire' THEN -1
WHEN 'New Jersey' THEN -3
WHEN 'New Mexico' THEN -6
WHEN 'New York' THEN -2
WHEN 'North Carolina' THEN -5
WHEN 'North Dakota' THEN -2
WHEN 'Ohio' THEN -3
WHEN 'Oklahoma' THEN -6
WHEN 'Oregon' THEN -4
WHEN 'Pennsylvania' THEN -3
WHEN 'Puerto Rico' THEN -8
WHEN 'Rhode Island' THEN -2
WHEN 'South Carolina' THEN -6
WHEN 'South Dakota' THEN -3
WHEN 'Tennessee' THEN -5
WHEN 'Texas' THEN -7
WHEN 'Utah' THEN -4
WHEN 'Vermont' THEN -1
WHEN 'Virginia' THEN -5
WHEN 'Washington' THEN -2
WHEN 'West Virginia' THEN -4
WHEN 'Wisconsin' THEN -2
WHEN 'Wyoming' THEN -3
WHEN 'Yukon' THEN -0
WHEN 'Northwest Territories' THEN -0
WHEN 'Nanavut' THEN -0
WHEN 'Newfoundland & Labrador' THEN -0
WHEN 'British Columbia' THEN -1
WHEN 'Alberta' THEN -1
WHEN 'Saskatchewan' THEN -1
WHEN 'Manitoba' THEN -1
WHEN 'Ontario' THEN -1
WHEN 'Prince Edward Island' THEN -0
WHEN 'Quebec' THEN -1
WHEN 'New Brunswick' THEN -0
WHEN 'Nova Scotia' THEN -0
WHEN 'Unknown' THEN -6.5
END
CASE [Your Long State/Province Field]
WHEN 'Alabama' THEN 7.5
WHEN 'Alaska' THEN 0.5
WHEN 'American Samoa' THEN .5
WHEN 'Arizona' THEN 3
WHEN 'Arkansas' THEN 6
WHEN 'California' THEN 2
WHEN 'Colorado' THEN 4
WHEN 'Connecticut' THEN 11
WHEN 'Delaware' THEN 10.5
WHEN 'District of Columbia' THEN 8.5
WHEN 'Florida' THEN 8.5
WHEN 'Georgia' THEN 8
WHEN 'Guam' THEN 1
WHEN 'Hawaii' THEN 1.5
WHEN 'Idaho' THEN 2
WHEN 'Illinois' THEN 6
WHEN 'Indiana' THEN 7
WHEN 'Iowa' THEN 5
WHEN 'Kansas' THEN 5
WHEN 'Kentucky' THEN 6.5
WHEN 'Louisiana' THEN 5.5
WHEN 'Maine' THEN 12
WHEN 'Maryland' THEN 9.5
WHEN 'Massachusetts' THEN 10.5
WHEN 'Michigan' THEN 7.5
WHEN 'Minnesota' THEN 4.5
WHEN 'Mississippi' THEN 6.5
WHEN 'Missouri' THEN 5.5
WHEN 'Montana' THEN 2.5
WHEN 'Nebraska' THEN 4.5
WHEN 'Nevada' THEN 2.5
WHEN 'New Hampshire' THEN 11
WHEN 'New Jersey' THEN 10
WHEN 'New Mexico' THEN 3.5
WHEN 'New York' THEN 9.5
WHEN 'North Carolina' THEN 9
WHEN 'North Dakota' THEN 3.5
WHEN 'Ohio' THEN 8
WHEN 'Oklahoma' THEN 4.5
WHEN 'Oregon' THEN 1.5
WHEN 'Pennsylvania' THEN 9
WHEN 'Puerto Rico' THEN 11
WHEN 'Rhode Island' THEN 11.5
WHEN 'South Carolina' THEN 8.5
WHEN 'South Dakota' THEN 4
WHEN 'Tennessee' THEN 7
WHEN 'Texas' THEN 4
WHEN 'Utah' THEN 3.5
WHEN 'Vermont' THEN 10
WHEN 'Virginia' THEN 8
WHEN 'Washington' THEN 1.5
WHEN 'West Virginia' THEN 7.5
WHEN 'Wisconsin' THEN 5.5
WHEN 'Wyoming' THEN 3
WHEN 'Yukon' THEN 1.5
WHEN 'Northwest Territories' THEN 2.5
WHEN 'Nanavut' THEN 3.5
WHEN 'Newfoundland & Labrador' THEN 9.5
WHEN 'British Columbia' THEN 2
WHEN 'Alberta' THEN 3
WHEN 'Saskatchewan' THEN 4
WHEN 'Manitoba' THEN 5
WHEN 'Ontario' THEN 7
WHEN 'Prince Edward Island' THEN 11.5
WHEN 'Quebec' THEN 9
WHEN 'New Brunswick' THEN 10.5
WHEN 'Nova Scotia' THEN 12.5
WHEN 'Unknown' THEN 12
END
CASE [Your Long State/Province Field]
WHEN 'Alabama' THEN 'AL'
WHEN 'Alaska' THEN 'AK'
WHEN 'Arizona' THEN 'AZ'
WHEN 'Arkansas' THEN 'AR'
WHEN 'American Samoa' THEN 'AS'
WHEN 'California' THEN 'CA'
WHEN 'Colorado' THEN 'CO'
WHEN 'Connecticut' THEN 'CT'
WHEN 'Delaware' THEN 'DE'
WHEN 'District of Columbia' THEN 'DC'
WHEN 'Florida' THEN 'FL'
WHEN 'Georgia' THEN 'GA'
WHEN 'Guam' THEN 'GU'
WHEN 'Hawaii' THEN 'HI'
WHEN 'Idaho' THEN 'ID'
WHEN 'Illinois' THEN 'IL'
WHEN 'Indiana' THEN 'IN'
WHEN 'Iowa' THEN 'IA'
WHEN 'Kansas' THEN 'KS'
WHEN 'Kentucky' THEN 'KY'
WHEN 'Louisiana' THEN 'LA'
WHEN 'Maine' THEN 'ME'
WHEN 'Maryland' THEN 'MD'
WHEN 'Massachusetts' THEN 'MA'
WHEN 'Michigan' THEN 'MI'
WHEN 'Minnesota' THEN 'MN'
WHEN 'Mississippi' THEN 'MS'
WHEN 'Missouri' THEN 'MO'
WHEN 'Montana' THEN 'MT'
WHEN 'Nebraska' THEN 'NE'
WHEN 'Nevada' THEN 'NV'
WHEN 'New Hampshire' THEN 'NH'
WHEN 'New Jersey' THEN 'NJ'
WHEN 'New Mexico' THEN 'NM'
WHEN 'New York' THEN 'NY'
WHEN 'North Carolina' THEN 'NC'
WHEN 'North Dakota' THEN 'ND'
WHEN 'Ohio' THEN 'OH'
WHEN 'Oklahoma' THEN 'OK'
WHEN 'Oregon' THEN 'OR'
WHEN 'Pennsylvania' THEN 'PA'
WHEN 'Puerto Rico' THEN 'PR'
WHEN 'Rhode Island' THEN 'RI'
WHEN 'South Carolina' THEN 'SC'
WHEN 'South Dakota' THEN 'SD'
WHEN 'Tennessee' THEN 'TN'
WHEN 'Texas' THEN 'TX'
WHEN 'Utah' THEN 'UT'
WHEN 'Vermont' THEN 'VT'
WHEN 'Virginia' THEN 'VA'
WHEN 'Washington' THEN 'WA'
WHEN 'West Virginia' THEN 'WV'
WHEN 'Wisconsin' THEN 'WI'
WHEN 'Wyoming' THEN 'WY'
WHEN 'Yukon' THEN 'YT'
WHEN 'Northwest Territories' THEN 'NT'
WHEN 'Nanavut' THEN 'NU'
WHEN 'Newfoundland & Labrador' THEN 'NL'
WHEN 'British Columbia' THEN 'BC'
WHEN 'Alberta' THEN 'AB'
WHEN 'Saskatchewan' THEN 'SK'
WHEN 'Manitoba' THEN 'MB'
WHEN 'Ontario' THEN 'ON'
WHEN 'Quebec' THEN 'QC'
WHEN 'New Brunswick' THEN 'NB'
WHEN 'Nova Scotia' THEN 'NS'
WHEN 'Prince Edward Island' THEN 'PEI'
WHEN 'Unknown' THEN 'Unkn.'
END
Download a hexagon image file to your pc. Move that file to your Tableau Repository in Documents > My Tableau Repository > Shapes > Custom as a Custom shape.
In a new Tableau worksheet…
My hex map - I colored the states and provinces by country! You’ll probably put a measure on the Color shelf, though.
Now you can add any Measure to the color shelf to allow the user to see your key facts in EVERY state and province, while still maintaining regional fidelity and the beauty of a map :)
-2.gif)
If you’re a data enthusiast, analytics professional, or just someone curious about Tableau’s latest innovations, the Tableau Conference 2025 is your...

Tableau Plus is the new premium offering from Tableau, a leading data visualization and business intelligence platform. It builds upon the...

If you've spent any time working with Tableau, you've likely encountered the dreaded "Cannot Mix Aggregate and Non-Aggregate Arguments" error. It's a...