Human Centered Data™. This is the way.
Always put people at the heart of your analytics efforts. One of my favorite things about our team...

Always put people at the heart of your analytics efforts. One of my favorite things about our team...

You have a great understanding of linear regression, but you have been baffled with a dataset which...

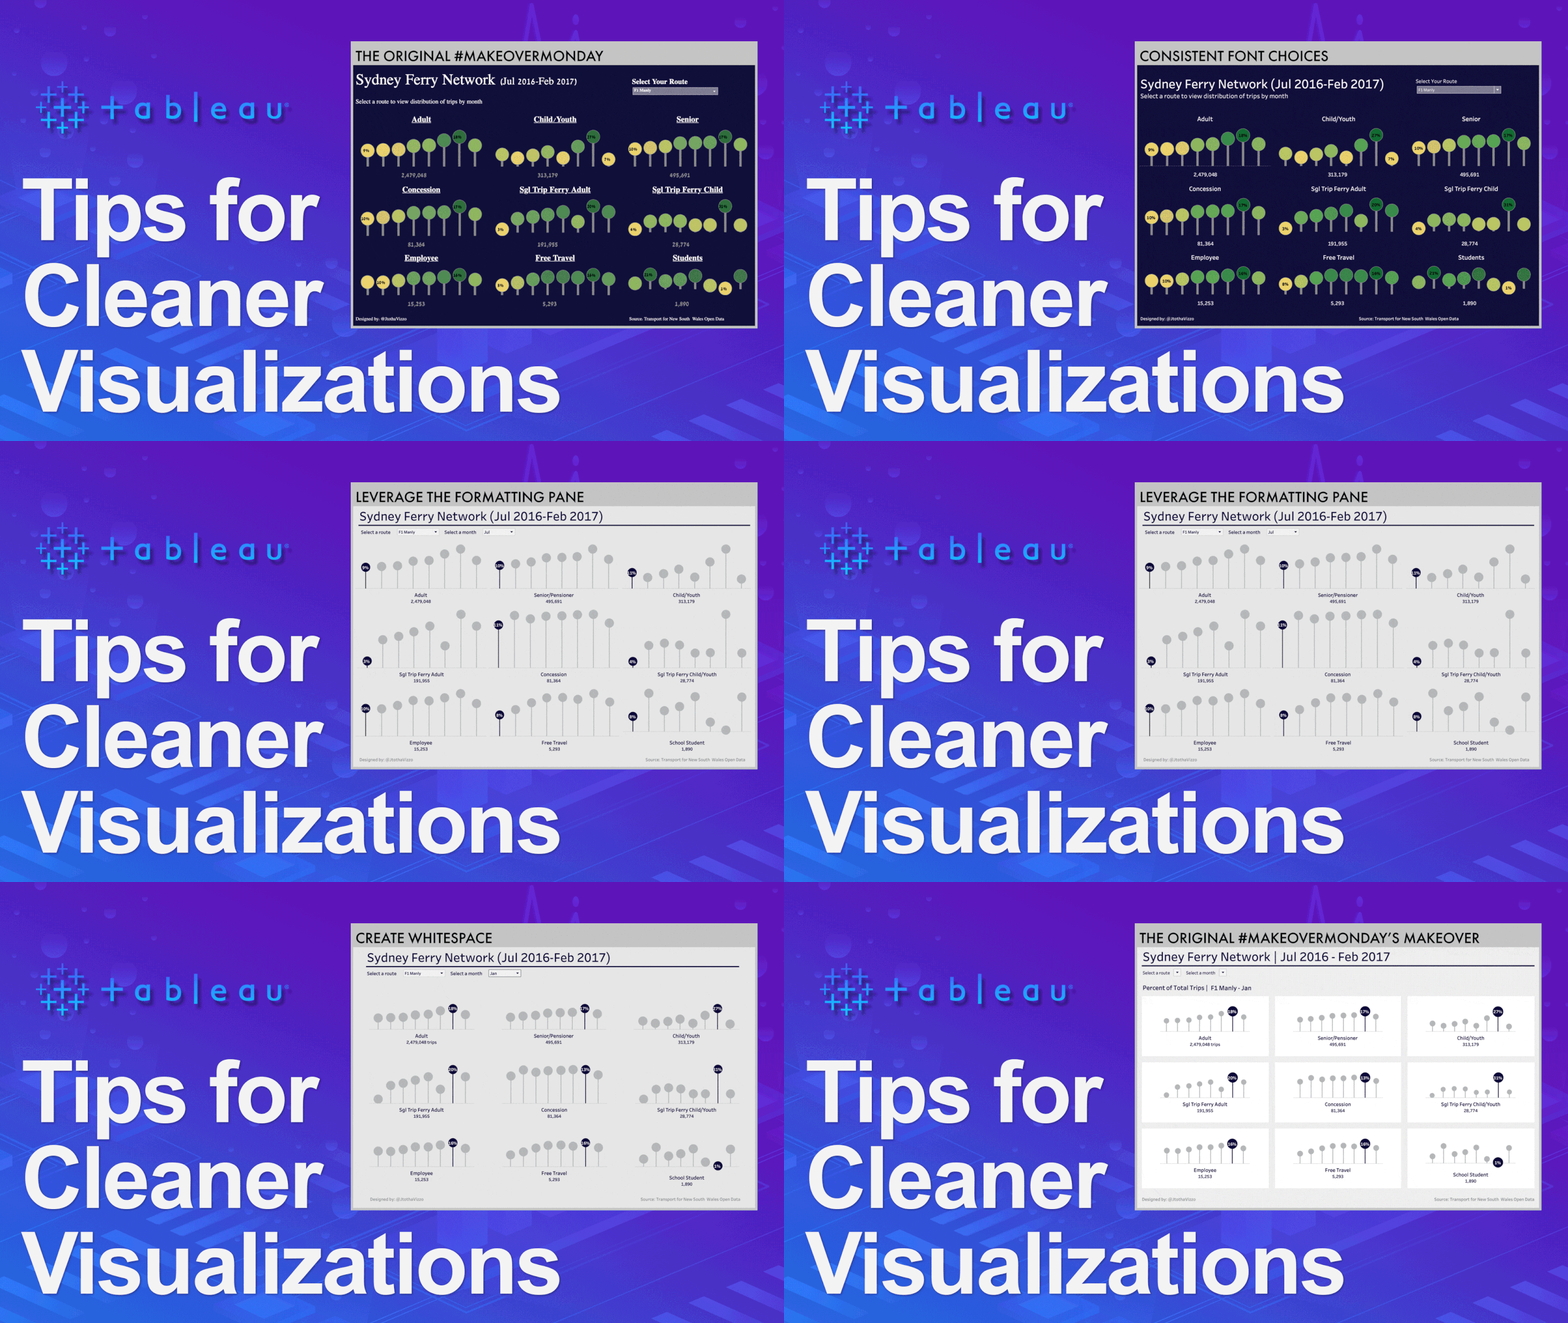
On April 30th, 2017 I published my very first Makeover Monday visualization to Tableau Public. It...

Leading up to the 2020 NBA Draft, I shared a Tableau Public visualization called NBA Draft Gems,...

Have you ever had the need to zoom in and zoom out on a chart? Have you needed to be able to see...

Web maps are tricky. Let's say you are using a dataset to compare sales across states and provinces...

Tableau’s latest quarterly release in Q1 2020 was jam packed with amazing features that have...

Once upon a time, every great dashboard I built used floating objects for almost everything. It was...