Tableau Conference 2025 | Know Before You Go
If you’re a data enthusiast, analytics professional, or just someone curious about Tableau’s latest innovations, the Tableau Conference 2025 is your...

Have you ever had the need to zoom in and zoom out on a chart? Have you needed to be able to see the intricate peaks and valleys, yet also see the big picture?
In 5 simple steps, your users will have the ability to easily zoom in and out of your line charts.
Create a string parameter using a list for allowable values.
The parameter will be how your users interact with the chart.
This calculation will turn on and off the 0 axis once all 5 steps are completed.
Graph View Calc
CASE [Graph View]
WHEN "FULL VIEW" THEN 0
WHEN "DETAILED VIEW" THEN NULL
END
Create your line chart as you typically would, but then drag Graph View Calc (created in step 2) onto the Detail marks card.
Using the Analytics tab, drag “Reference Line” onto your chart. In the edit window, change the following:
**We want this line to be invisible to the user!
The final and most important step to making this work:
When you create your dashboard, make sure to show the parameter so that your users can take advantage of this cool new feature.
-2.gif)
If you’re a data enthusiast, analytics professional, or just someone curious about Tableau’s latest innovations, the Tableau Conference 2025 is your...

Tableau Plus is the new premium offering from Tableau, a leading data visualization and business intelligence platform. It builds upon the...

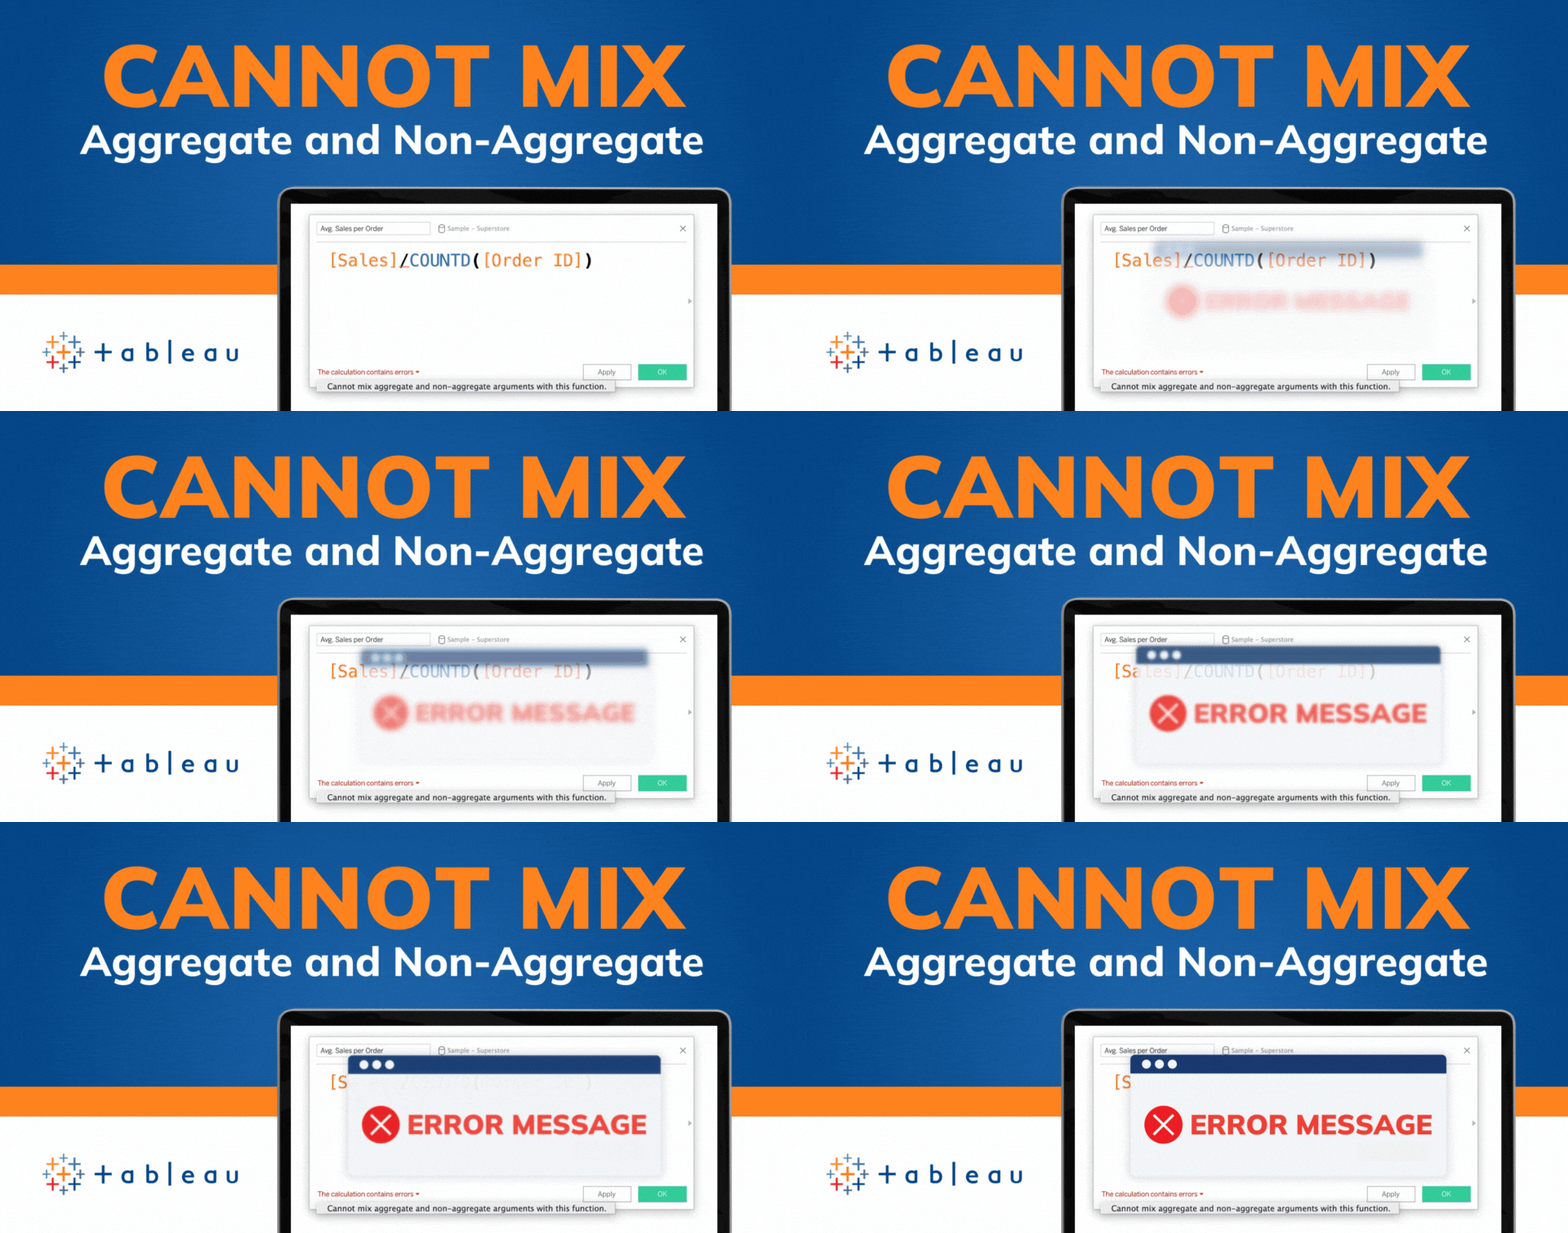
If you've spent any time working with Tableau, you've likely encountered the dreaded "Cannot Mix Aggregate and Non-Aggregate Arguments" error. It's a...