

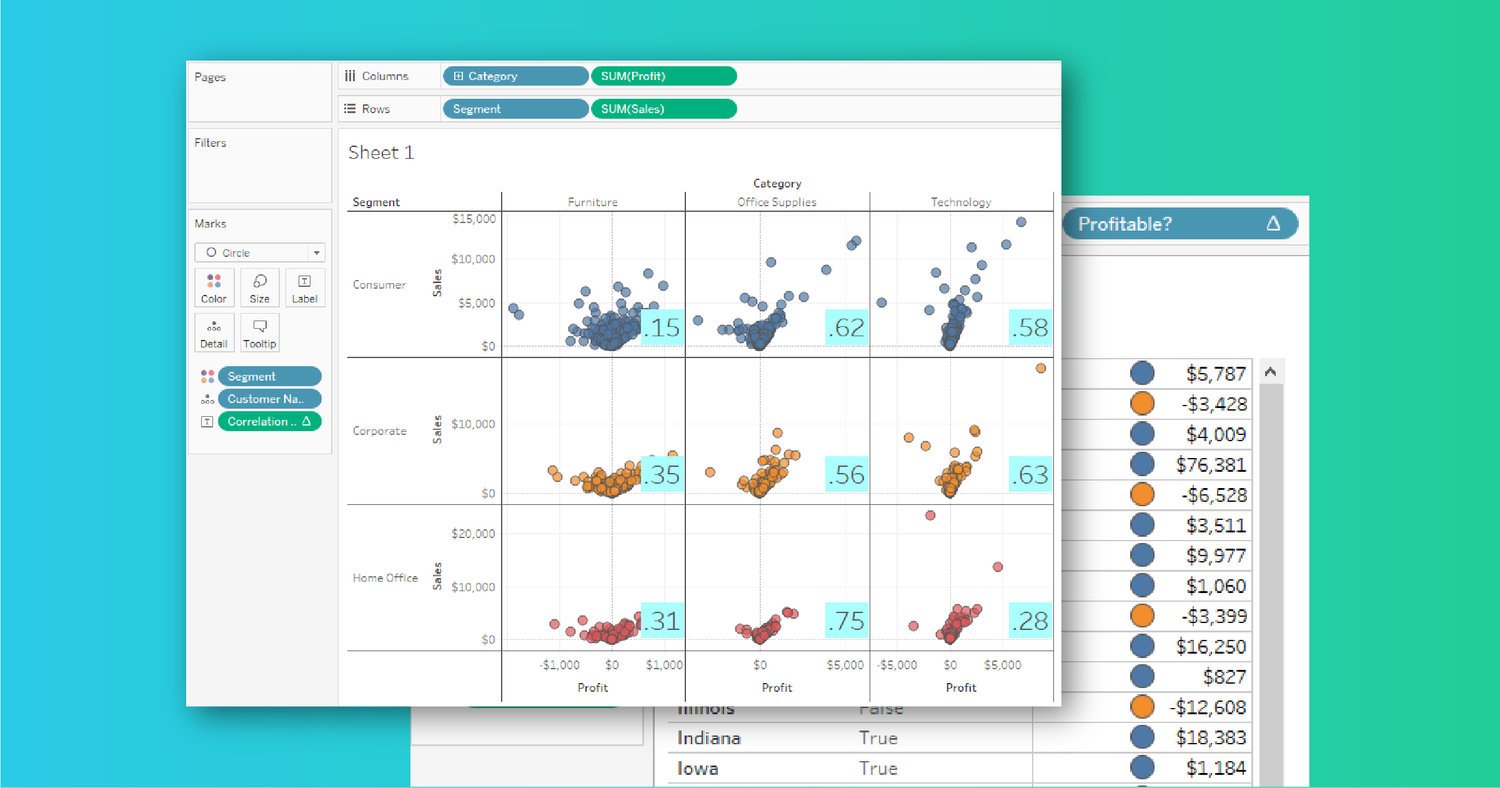
How to QA Tough Calculated Fields (Without Pulling Your Hair Out)
It’s tempting to try and solve calculation problems on the fly in your visualizations. Just slap...

It’s tempting to try and solve calculation problems on the fly in your visualizations. Just slap...

Last year, Tableau released a small revision to their subscription pricing model and it’s a big win...

2021 was a prominent and influential year in the world of Human Resources. The pandemic pushed...
A common issue many analysts face throughout their career is breaking down data silos to bring...
Supply Chain has become the term of the year thanks to the recent spotlight it’s been given during...

In this blog post, intended for new Power BI developers, I identify some easy-to-use features that...

I recently took and passed the Tableau Desktop Specialist exam. In this blog post, I’ll walk...
A couple of weeks ago, I published a Tableau Public workbook called Tableau Dashboard Layout...
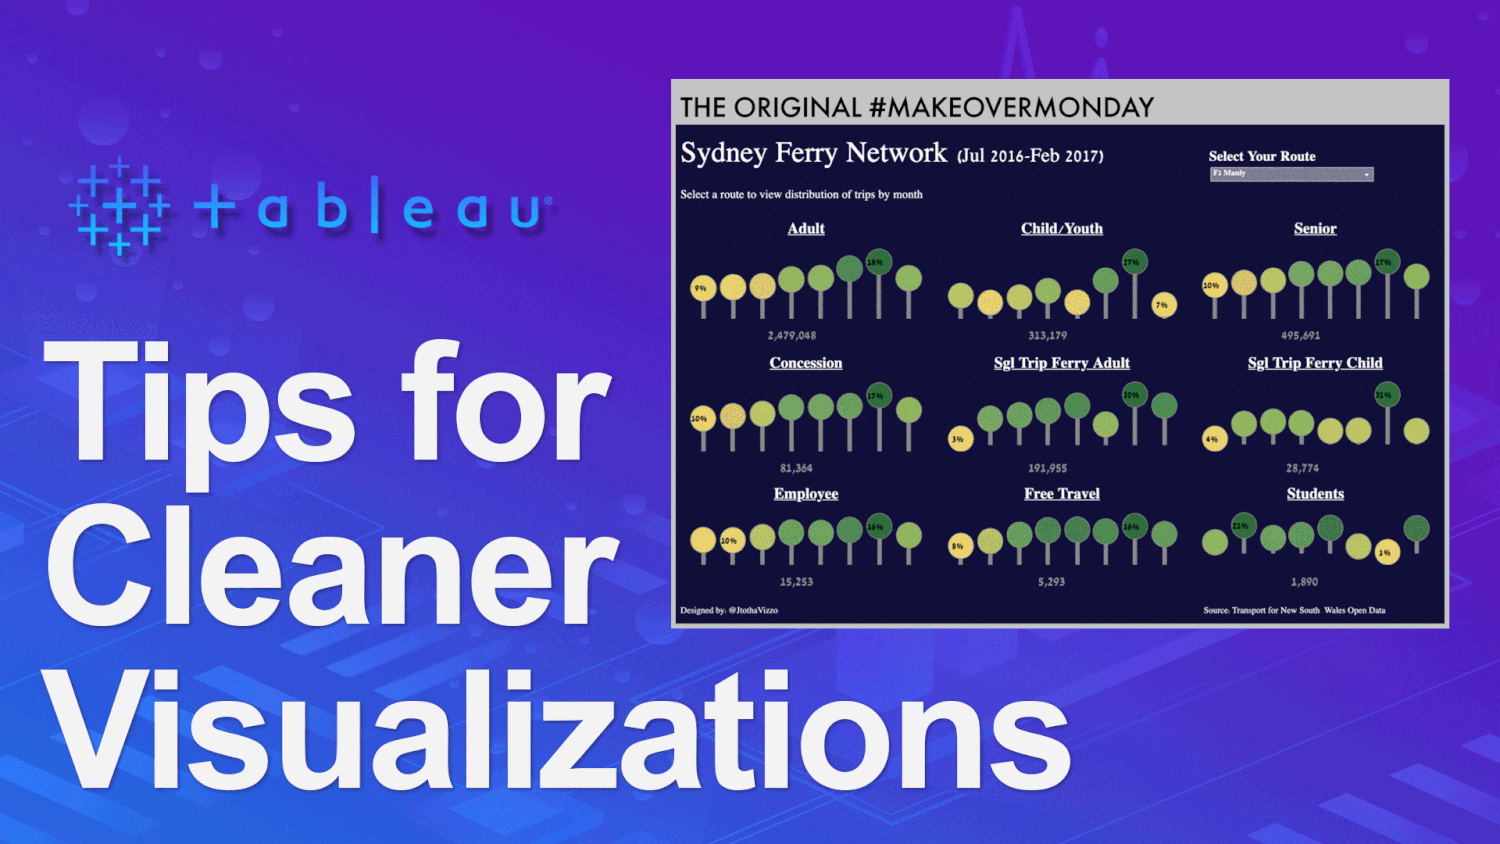
On April 30th, 2017 I published my very first Makeover Monday visualization to Tableau Public. It...
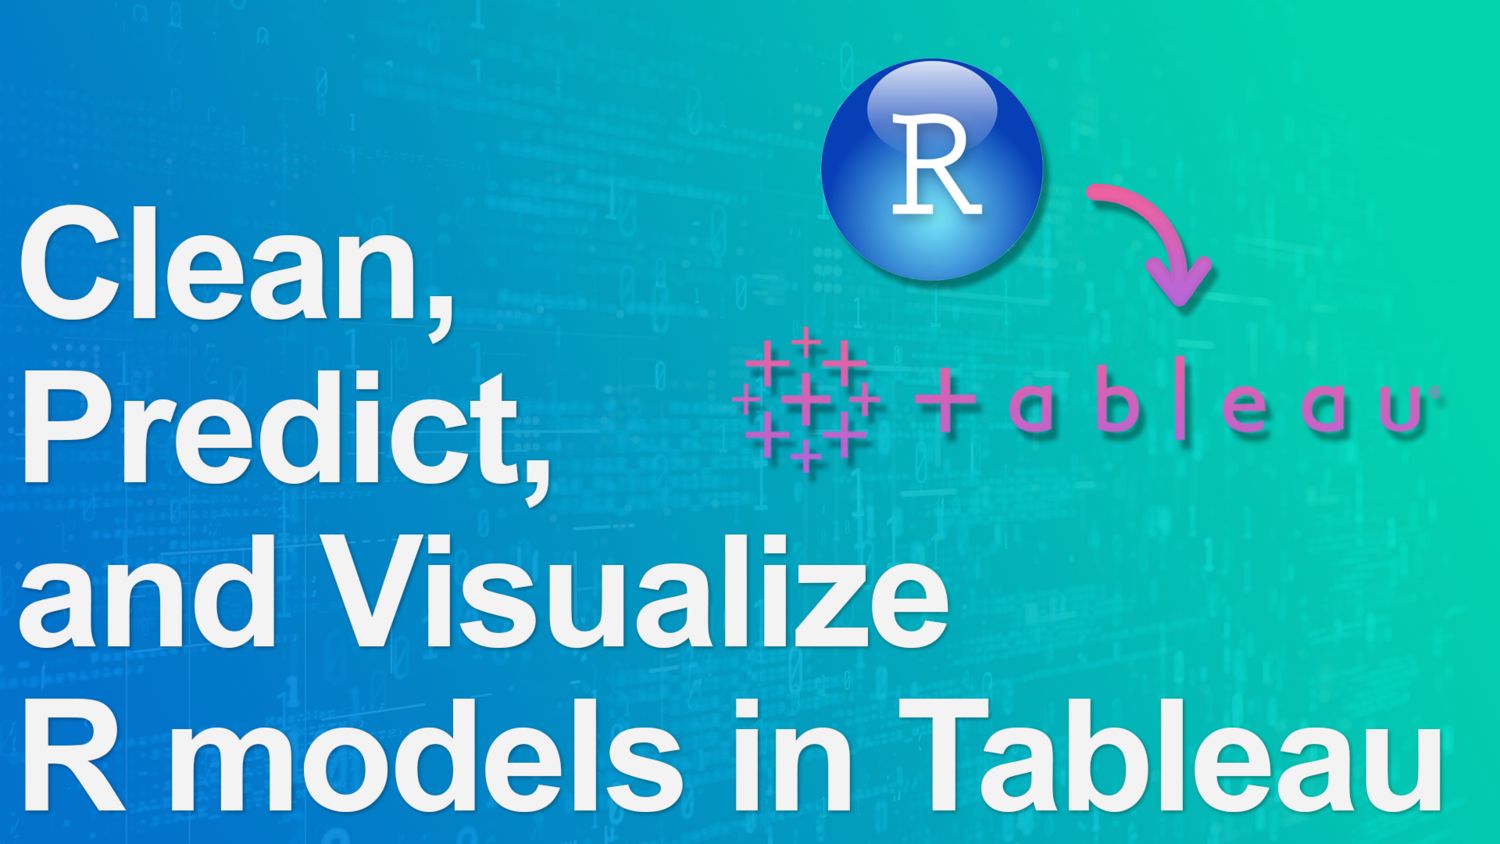
So you acquired all this of this awesome data and you’re asked to build a model to predict an...

Have you ever had the need to zoom in and zoom out on a chart? Have you needed to be able to see...

Web maps are tricky. Let's say you are using a dataset to compare sales across states and provinces...
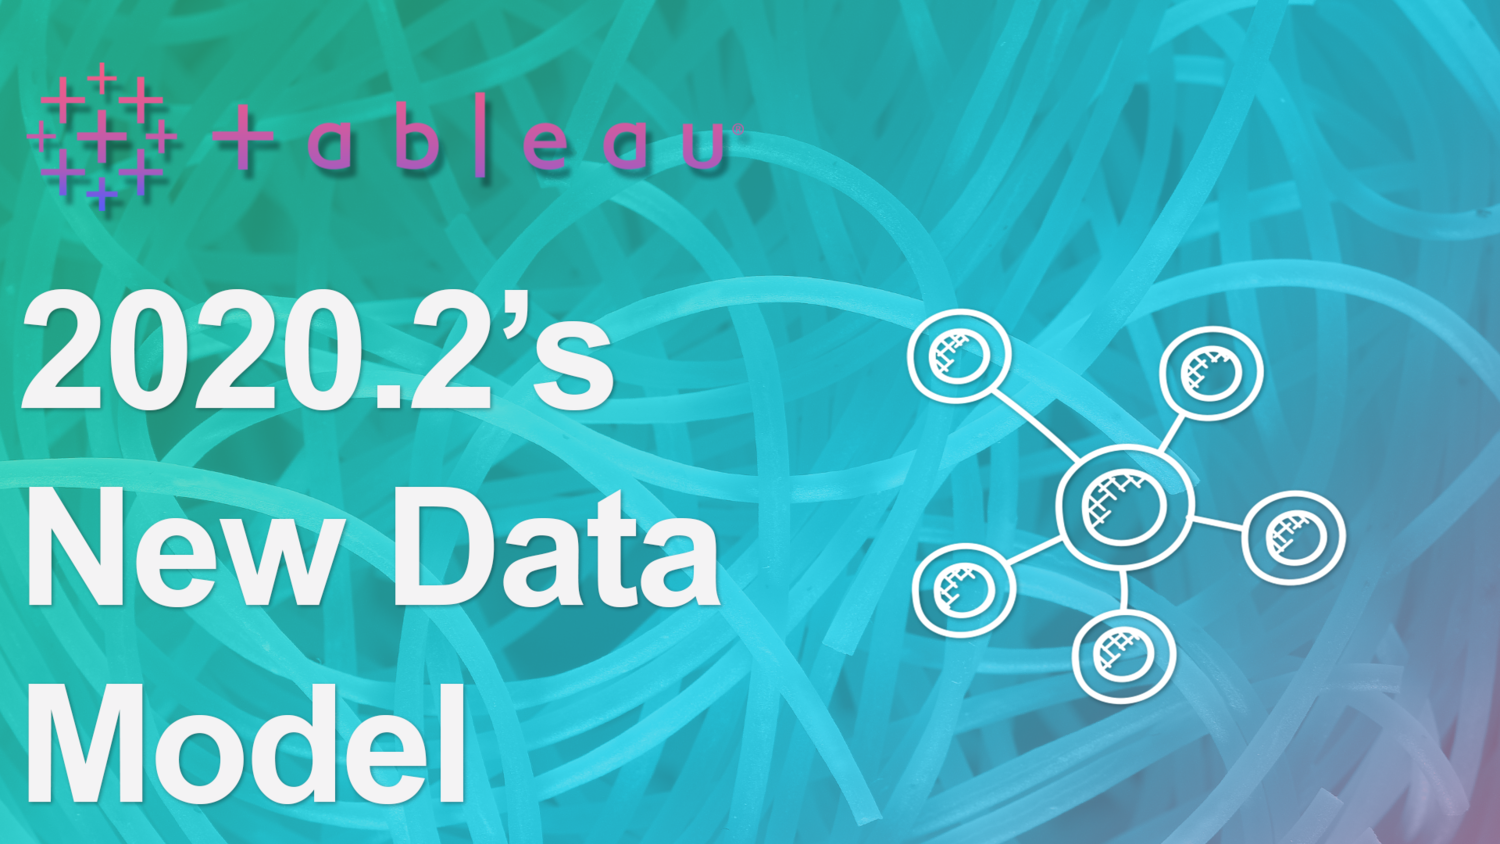
Tableau's Fancy Feature in 2020.2 "The Noodle" Tableau continues to add awesome new features with...
Once upon a time, every great dashboard I built used floating objects for almost everything. It was...

I recently sat in on a user acceptance testing (UAT) meeting. We are in the final stages of UAT and...

There are three levels of Tableau Desktop certifications (Specialist, Certified Associate, and...
By now, TabPy should be installed and connected to your Tableau Desktop v10.1+. This post is...