Tableau Conference 2025 | Know Before You Go
If you’re a data enthusiast, analytics professional, or just someone curious about Tableau’s latest innovations, the Tableau Conference 2025 is your...

Supply Chain has become the term of the year thanks to the recent spotlight it’s been given during the pandemic. After all, it’s the generic reason why grocery shelves are periodically empty, lumber prices are high, and home remodeling supplies have thirty-six weeks or longer lead times.
Thank you to Google Trends for showing us this five-year history of the search “Supply Chain” in the United States.
Supply Chain can mean different things to different people, so let’s quickly call out what we’re referring to here. Collectively, it’s all the steps a product takes from raw materials to a final product purchased by the end-user.
Let’s look at a timely example: Toilet Paper.

Here are some likely steps that go into getting it on the shelves of your favorite retailer:
[Time goes by…]

Let’s analyze a couple of scenarios:
Poor weather conditions for the log handler to get his work done could add one week. The mill could have unscheduled downtime due to poor maintenance schedules, add one more week. A snowstorm in the midwest drops three feet of snow, making the roads impassable: add at least one week. The line schedulers see that everything has finally arrived and they are about to run the product, but alas, a contagious outbreak causes the line to shut down for the next 10 days. Bummer, production is now four or more weeks late.
Let’s imagine for a moment you’re the manufacturer. Since your demand has been steady, the four weeks of safety stock you had built into your inventory levels, despite your accounting department’s best efforts, can fill most of the gap and you should be able to recover with minimal expediting fees.
But wait: Because every consumer of toilet paper purchased one to three additional packages on account of the pandemic, demand has increased 325% overnight. That four-week safety stock is less than one week. Your demand planning team is in disbelief checking and re-checking their data management systems. People are panicking! Consumers are now waiting in lines outside of their grocery stores before store-opening to get a ticket for one package of toilet paper. Your phone is ringing off the hook because these stores are reminding you how important of a customer they are to you. Ouch.
How can you keep your service levels from falling any faster? How much is this going to cost the company? What is happening?! The CEO is now ringing your phone and you need to provide answers. Now.

Toilet paper aside, we are seeing the term “Supply Chain” more today than we ever have. Why? Because those of us that work in this field have always been successful at absorbing one or two setbacks. However, we never, or rarely, experience everything going wrong at one time. In the example above, it's clear how one can quickly begin to drown with demand inflating, despite producing at 100% capacity. Even if everything else went smoothly, how can the supply chain recover from an increase in demand of 100%-400% (seemingly overnight)?

Let’s chat supply chain analytics for a minute.
What if all of your systems and data warehouses could talk to each other? Better yet, what if they could talk to you? If you were able to see from one database that raw materials from the field were late, you may have been able to alert the plant that they had some much-needed time for maintenance. After all, you could have been able to see that maintenance was overdue. By adding HR analytics to the mix, could you have seen that your employees’ unexpected absences have been ticking up indicating a potential illness outbreak on the horizon?

Supply Chain is used to having the unexpected happen (pirates seizing the container ship, rail cars being misplaced, potatoes freezing to the interstate, inclement weather, etc). Unless you have a crystal ball, we can’t do much about these. We can, however, start using the data we have already collected in a way that prepares us for the scenarios we can prevent.
What do you use to check supply chain performance today? Is it healthy? Or are you on the verge of disruption? Our team is happy to help explore the health of your supply chain analytics program with you and get you set up for success.
-2.gif)
If you’re a data enthusiast, analytics professional, or just someone curious about Tableau’s latest innovations, the Tableau Conference 2025 is your...

Tableau Plus is the new premium offering from Tableau, a leading data visualization and business intelligence platform. It builds upon the...

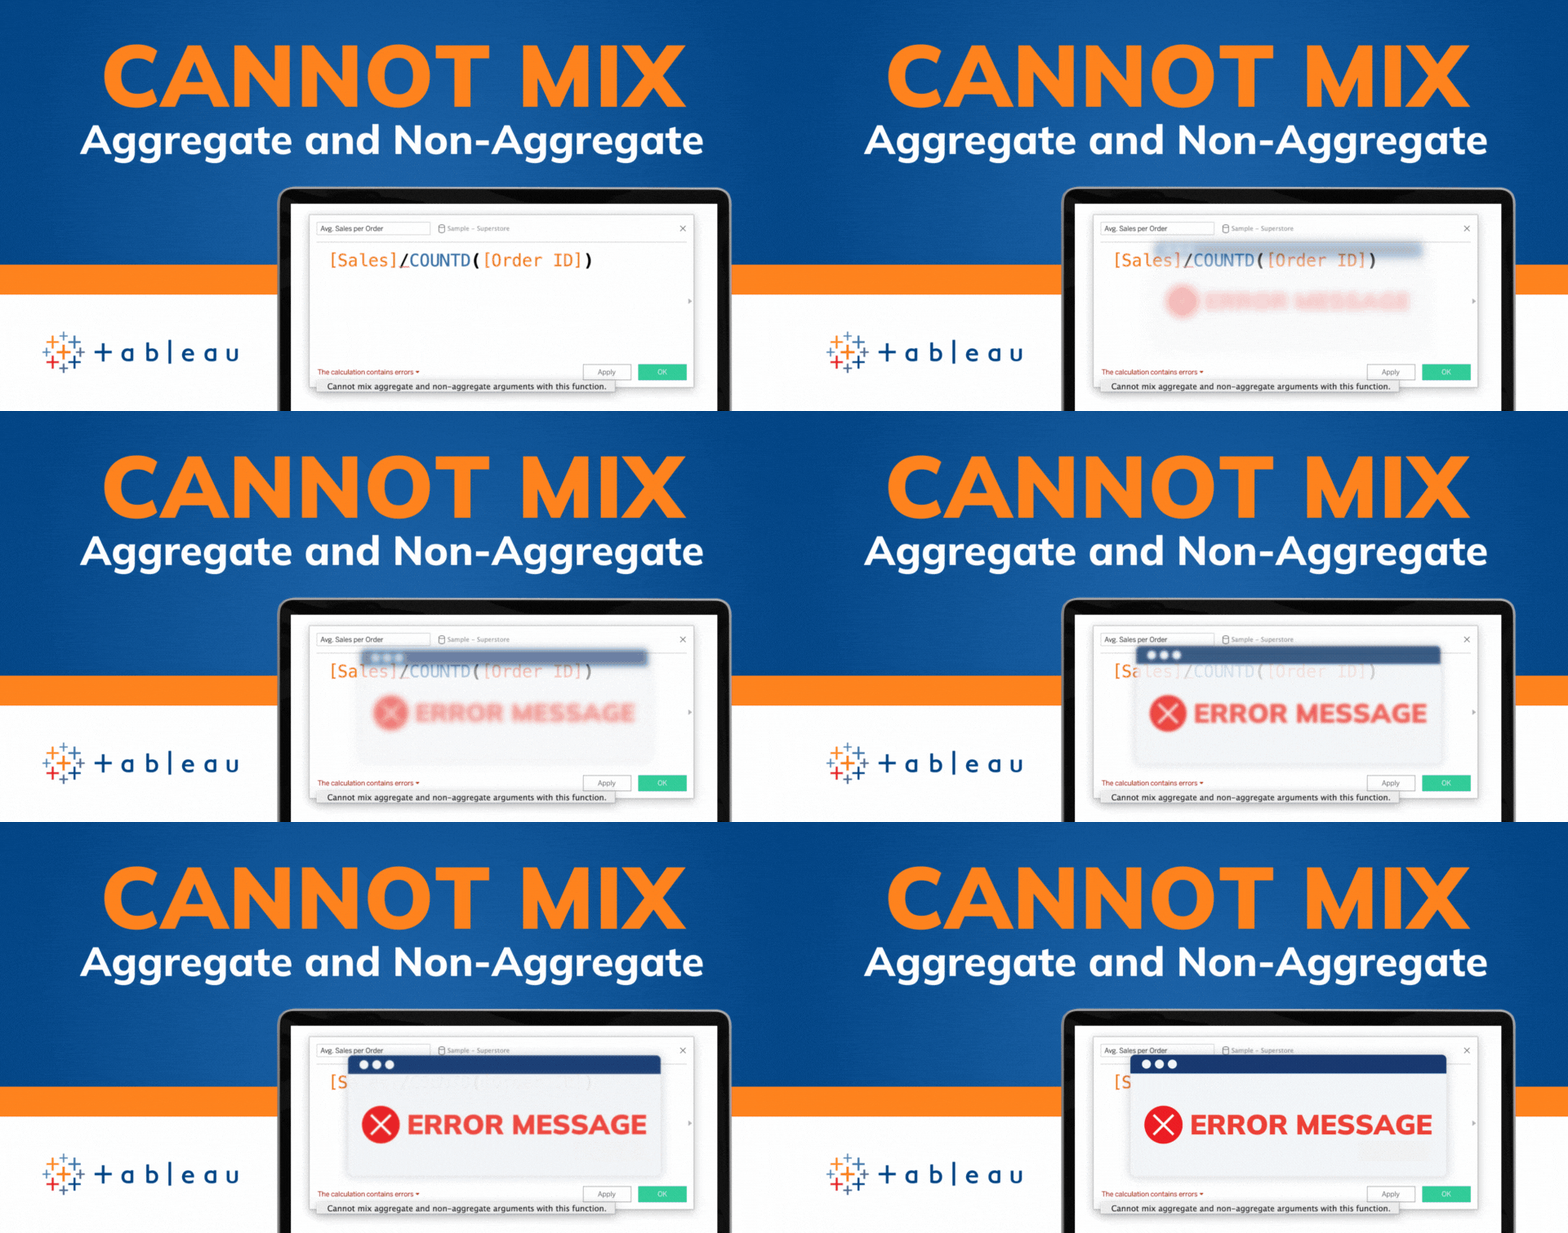
If you've spent any time working with Tableau, you've likely encountered the dreaded "Cannot Mix Aggregate and Non-Aggregate Arguments" error. It's a...