

 Mahzabin Khan
Tableau Conference 2025 | Know Before You Go
If you’re a data enthusiast, analytics professional, or just someone curious about Tableau’s latest innovations, the Tableau Conference 2025 is your...
You have a great understanding of linear regression, but you have been baffled with a dataset which requires you to run a logistic regression model. Stressing over understanding the concept, coding and interpreting the results? Fear no more! This blog will walk you through exactly that.
In this blog, I will guide you through the basic concept of logistic regression. Furthermore, I will show you how to code and run a binomial logistic regression model in R and how to interpret its results.
Let’s get started!

Logistic regression is similar to linear regression. The only difference is, unlike linear regression where you predict a continuous variable, you predict whether something is TRUE (1) or FALSE (0). This is specifically called the Binary Logistic regression model. There are two other types of logistic models called Multinomial logistic regression and Ordinal logistic regression models. In this blog, we are primarily working with the Binary regression model.
For example,
The dependent variable for a binary logistic regression model is always binary (1 or 0). From our example 1, an automatic car will hold a value of 1 and 0 if it is not.
You can have a simple logistic regression or a more complicated logistic regression. Let’s consider example 1 again where you are trying to predict whether a car is automatic or manual.
A simple logistic regression model would be where the transmission mode (automatic or manual) is predicted by Horsepower.
Transmission ~ Horsepower
Whereas, a more complicated model would be where Transmission is predicted by Horsepower, Mpg and the Engine shape of the car.
Transmission ~ Horsepower + Mpg + Engine Shape (v shape or straight)
From the model above, you can see that a logistic regression model can have both continuous and discrete data as response variables. For our case, Horsepower and Mpg are both continuous where Engine shape is discrete. Logistic regressions ability to use both continuous and discrete variables to make predictions makes it a popular machine learning method.
One more primary difference between Linear and Logistic regression is that Logistic regression does not use the same concept of residuals like linear regression. Due to this difference, logistic regression can not compute your typical Rsquare; which is why interpreting the results are a little more complex and different from linear regression. However there are similar methods with the same objective as Rsquare specifically built for logistic regression, such as McFaddens Pseudo Rsquare.

Let’s get coding! We will be working off of our example 1 where we are predicting whether a car is automatic or manual.
Before we get started, make sure you have R installed in your device. I am using R studio version 1.4.1103. Once you have that, you can get connected to the data by following along.
For our data, we are using the built in dataset provided by R. In the following code, I am taking a look at what the dataset comes with and then selecting the desired variables that we want to use to build our model.
head(mtcars)
data <- mtcars[,c("am","hp","mpg","vs")]
These are the variables we are selecting:
Am = Automatic or Manual
Hp = Horsepower
Mpg = Miles per gallon
Vs = V-shaped engine (0) or Straight (1)
We can see that the data now has all the information we need for building the model. We know that “vs” is a discrete categorical variable so we must convert it to be a factor, otherwise R will treat it as a continuous variable.
data$vs <- factor(data$vs)
For our model, we will be using the built in function in R called glm which stands for generalized linear model. To fit it specifically as a logistic regression model we set the family as binomial.
model<- glm(am ~ mpg + hp + vs, data = cars.data, family = "binomial" )
Next, we will summarize the model to view the results.
summary(model)
And voila, the results!
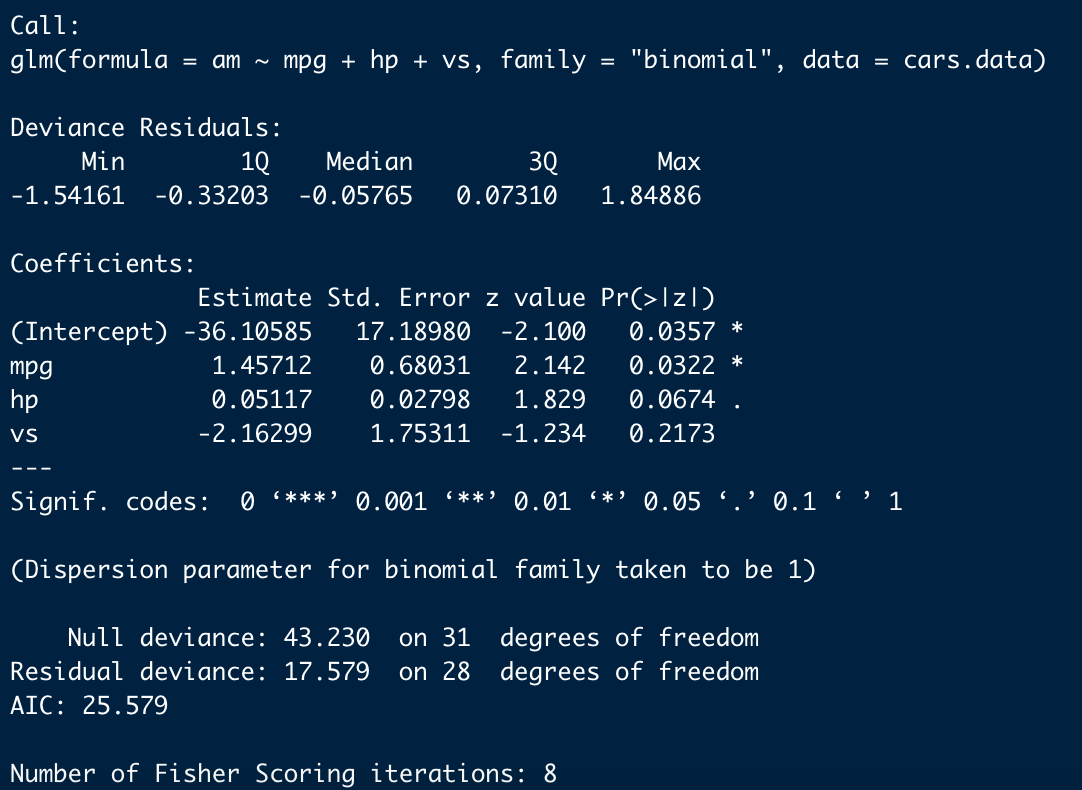
From the results above, we will be able to report which variables make a significant effect on predicting whether a car is automatic or not. The first thing you see in the result is the Call, which is R restating the model you ran. Secondly you see the Deviance Residuals - these can be used to assess model fit. Then finally you see the Coefficients, Standard error, Z- statistic (also known as Wald statistics).
The coefficients of a logistic regression model shows the change in log-odds for one unit increase in the predictor variable. The coefficients for mpg and hp are positive, whereas the vs coefficient is negative. A positive coefficient implies a positive association with the outcome variable; and a negative coefficient implies a negative association. However, to see if the variables are significantly making an impact, we would need to look at the p-value.
Depending on the alpha value chosen, you can determine whether a variable is significant or not. Assuming alpha is 0.05 for our case, we can see that the p-value for “hp” and “vs” is greater than 0.05. This means that they are not significantly making an impact to Transmission. However, we can see that the p-value for mpg is less than 0.05; this means that it is significantly affecting transmission in a positive way.
And there you have it! I hope this blog was able to give you some preliminary insight into binary logistic regression. If you have any questions, feel free to connect with me on LinkedIn; I would love to chat with you!
-2.gif)
If you’re a data enthusiast, analytics professional, or just someone curious about Tableau’s latest innovations, the Tableau Conference 2025 is your...

Tableau Plus is the new premium offering from Tableau, a leading data visualization and business intelligence platform. It builds upon the...

If you've spent any time working with Tableau, you've likely encountered the dreaded "Cannot Mix Aggregate and Non-Aggregate Arguments" error. It's a...