

 Kirsten Hoogenakker
Tableau Conference 2025 | Know Before You Go
If you’re a data enthusiast, analytics professional, or just someone curious about Tableau’s latest innovations, the Tableau Conference 2025 is your...
If you’ve been watching the enterprise data science space over the past few years, you’ve probably seen a new breed of tools emerge aimed at helping organizations turn data science into a scalable, organized, well-oiled practice within their businesses. A select few have risen to the top of the leaderboard, including a relative newcomer amongst some of the old legacy providers like SAS and IBM, called Dataiku. Dataiku is a transparent, collaborative, and approachable platform for developing data science models to improve business practices. They bring AI to the masses. I’ve been really impressed with what they’ve created, and wanted to share some of my favorite features with those considering a data science solution for their organization.
Right from the start, it’s overtly apparent the software is focused on providing a collaborative and intuitive workspace. Their developers have put in work to create icons, flows, and visual models that are easy for analysts, data scientists, and stakeholders to understand, from the early stages of data inflow to consumption-ready visualized reports, web apps, and more. It really is everyday AI that can transform raw data into business impact in an easy-to-use tool.
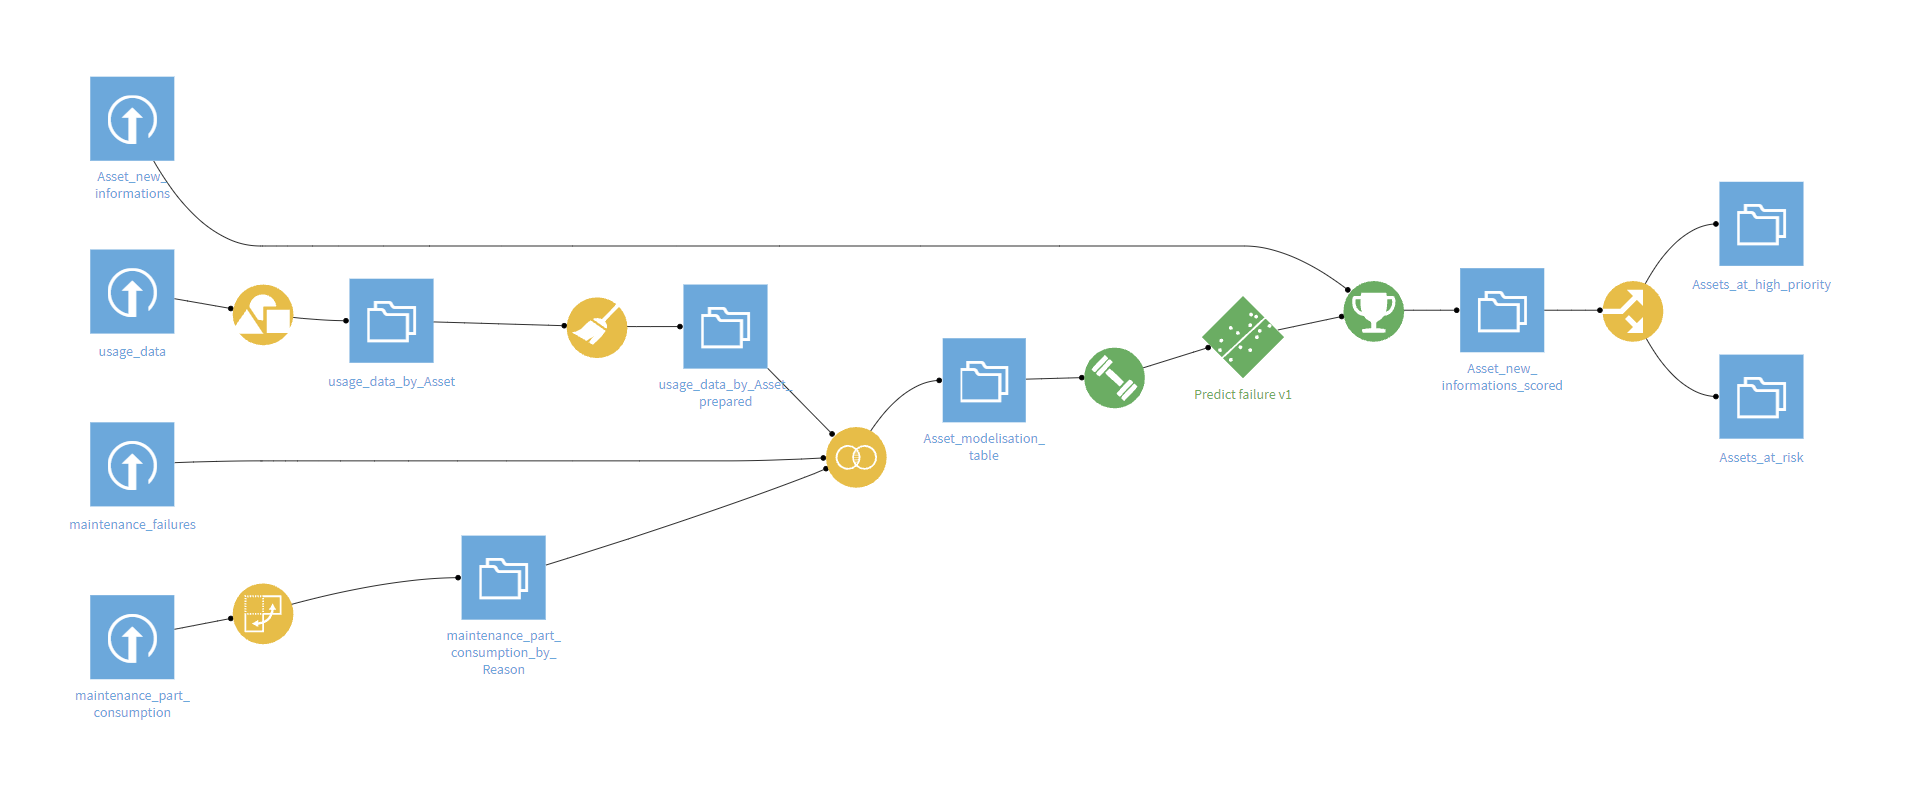
What an awesome way to visualize what’s happening to all of the data in the pipeline! I love that the flow uses both icons and colors to represent different items and stages of data prep and processing.
I can clearly see where my data is coming from (CSV, SQL, Snowflake, etc.), the type of modification on the dataset (cleaning, joining, splitting, machine learning training, scoring, etc) and it’s all color-coded. Because Dataiku can accept nearly ANY input in the flow, this is a really useful feature.
Not pictured here is the ability to further group these segments into flow zones and, recently updated, you can now use flow folding for really large flows. This gives users the ability to show and hide different segments so it’s easier to concentrate on the parts of upstream/downstream data flow you are focusing on.
Dataiku is agnostic in terms of the tech and skills needed to utilize their software. This really sets Dataiku apart from their competitors and is key to their value proposition. There is basically no limit on what type of data you are using or your preferred method of processing data. They categorize their users as ‘Coders’ and ‘Clickers’ so regardless of skill, this tool is designed to be accessible for any user.
What’s even better, is you don’t have to lock yourself into one experience or the other, you can switch between these two user experiences as you go. This means if you are someone like me who has coding experience, you can write scripts in Python or use a Jupyter notebook. Or, if you are currently working in more of an analyst capacity, you can drag and drop while still getting exposure to how it’s coding behind the scenes. It’s a great way to start leaning towards the code-heavy side if that’s an area you are hoping to grow in. Dataiku also provides some pre-made code templates from scikit_learn to make implementing machine learning faster and easier.
My favorite parts about their agnostic approach:
Connect to any data:
Code or Click:
This comes with an added bonus: the fact that the platform runs on common open-source code options means the product is extremely portable and likely familiar to data scientists already familiar with common languages and packages. Dataiku promises to be a future-proof end-to-end solution to make AI accessible to all users and consumers, and I think they are well-positioned to deliver.
One of the biggest challenges in the data science sphere is translating highly technical models into an output that makes sense to the end user. Rolling out an artificial intelligence solution can require a lot of steps:
data engineering > cleaning data > analyzing what’s there > building and tuning a model > analyzing the outputs > finally putting it into a visual that provides enough information for a business user to take action on.
Of course, don’t forget to tack on maintaining the model to make sure there isn’t any drift over time, working through a data governance framework to ensure permissioning promotes safe data practices, and drafting clear documented steps throughout the entire process.
Fortunately, the tool handles a lot of this work for us! The collaboration tools Dataiku put into their DSS provide the transparency needed to help satisfy the desires of the business teams I work with to understand what’s happening throughout the process. I love that it decentralizes each silo and blends the ability for different job titles to have a more communal approach.
There are opportunities built in to collaborate, converse, comment, and track changes over time. The communication that’s embedded into DSS puts some of the challenges of explaining a model to rest by saving visuals and tuning processes to the project for others to see. There are git-like repositories to help track changes and allow users to see who has worked on which portions of the pipeline and when.
No longer are analysts siloed from data scientists or data engineers only chatting amongst themselves at the (virtual?) water cooler. From the moment you log into a DSS instance, there is visibility into who is working on what projects and the ability to see an organized step-wise process along the way.
There are a TON of plugins available to ensure end-to-end processing in Dataiku. Because DataDrive is a Tableau Premier Partner, we spend a lot of time working with the tool, making the Tableau plugin one of my favorites! Pair this with Dataiku’s strong integration with Snowflake, and the platform becomes a powerhouse tool that can help span the entire BI stack, from data warehousing to dashboards consumed by end-users.
Another neat feature of Dataiku is the ability to build a web app that utilizes a machine learning model.
Are you looking to use machine learning and artificial intelligence to turn your data into a competitive advantage for your business? What about bringing your entire team of data practitioners together to break down siloed workflows and create collaborative AI masterpieces? The data science team here at DataDrive is ready to help you discover why organizations and data science geeks alike are getting excited about Dataiku and how it can enable your team to do more with your data.
-2.gif)
If you’re a data enthusiast, analytics professional, or just someone curious about Tableau’s latest innovations, the Tableau Conference 2025 is your...

Tableau Plus is the new premium offering from Tableau, a leading data visualization and business intelligence platform. It builds upon the...

If you've spent any time working with Tableau, you've likely encountered the dreaded "Cannot Mix Aggregate and Non-Aggregate Arguments" error. It's a...