

 Shahrukh Khan
Tableau Conference 2025 | Know Before You Go
If you’re a data enthusiast, analytics professional, or just someone curious about Tableau’s latest innovations, the Tableau Conference 2025 is your...
With data science and analytics now at the forefront of many industries, there’s a good chance you may have heard the word “trees” or “forests” in your analytics conversations. With this blog, we’re going to be diving into the random forest and how they are different from your standard decision trees.
Decision trees work by splitting data in order to narrow down variables until it reaches the answer you looking for within the data. In a prior blog, we looked at how to predict which animal a row of observations belonged to based on things like weight, if they had feathers, and their ability to fly. Here’s a quick rundown of some common terms related to decision trees that also apply to the random forest algorithm:
 .
.
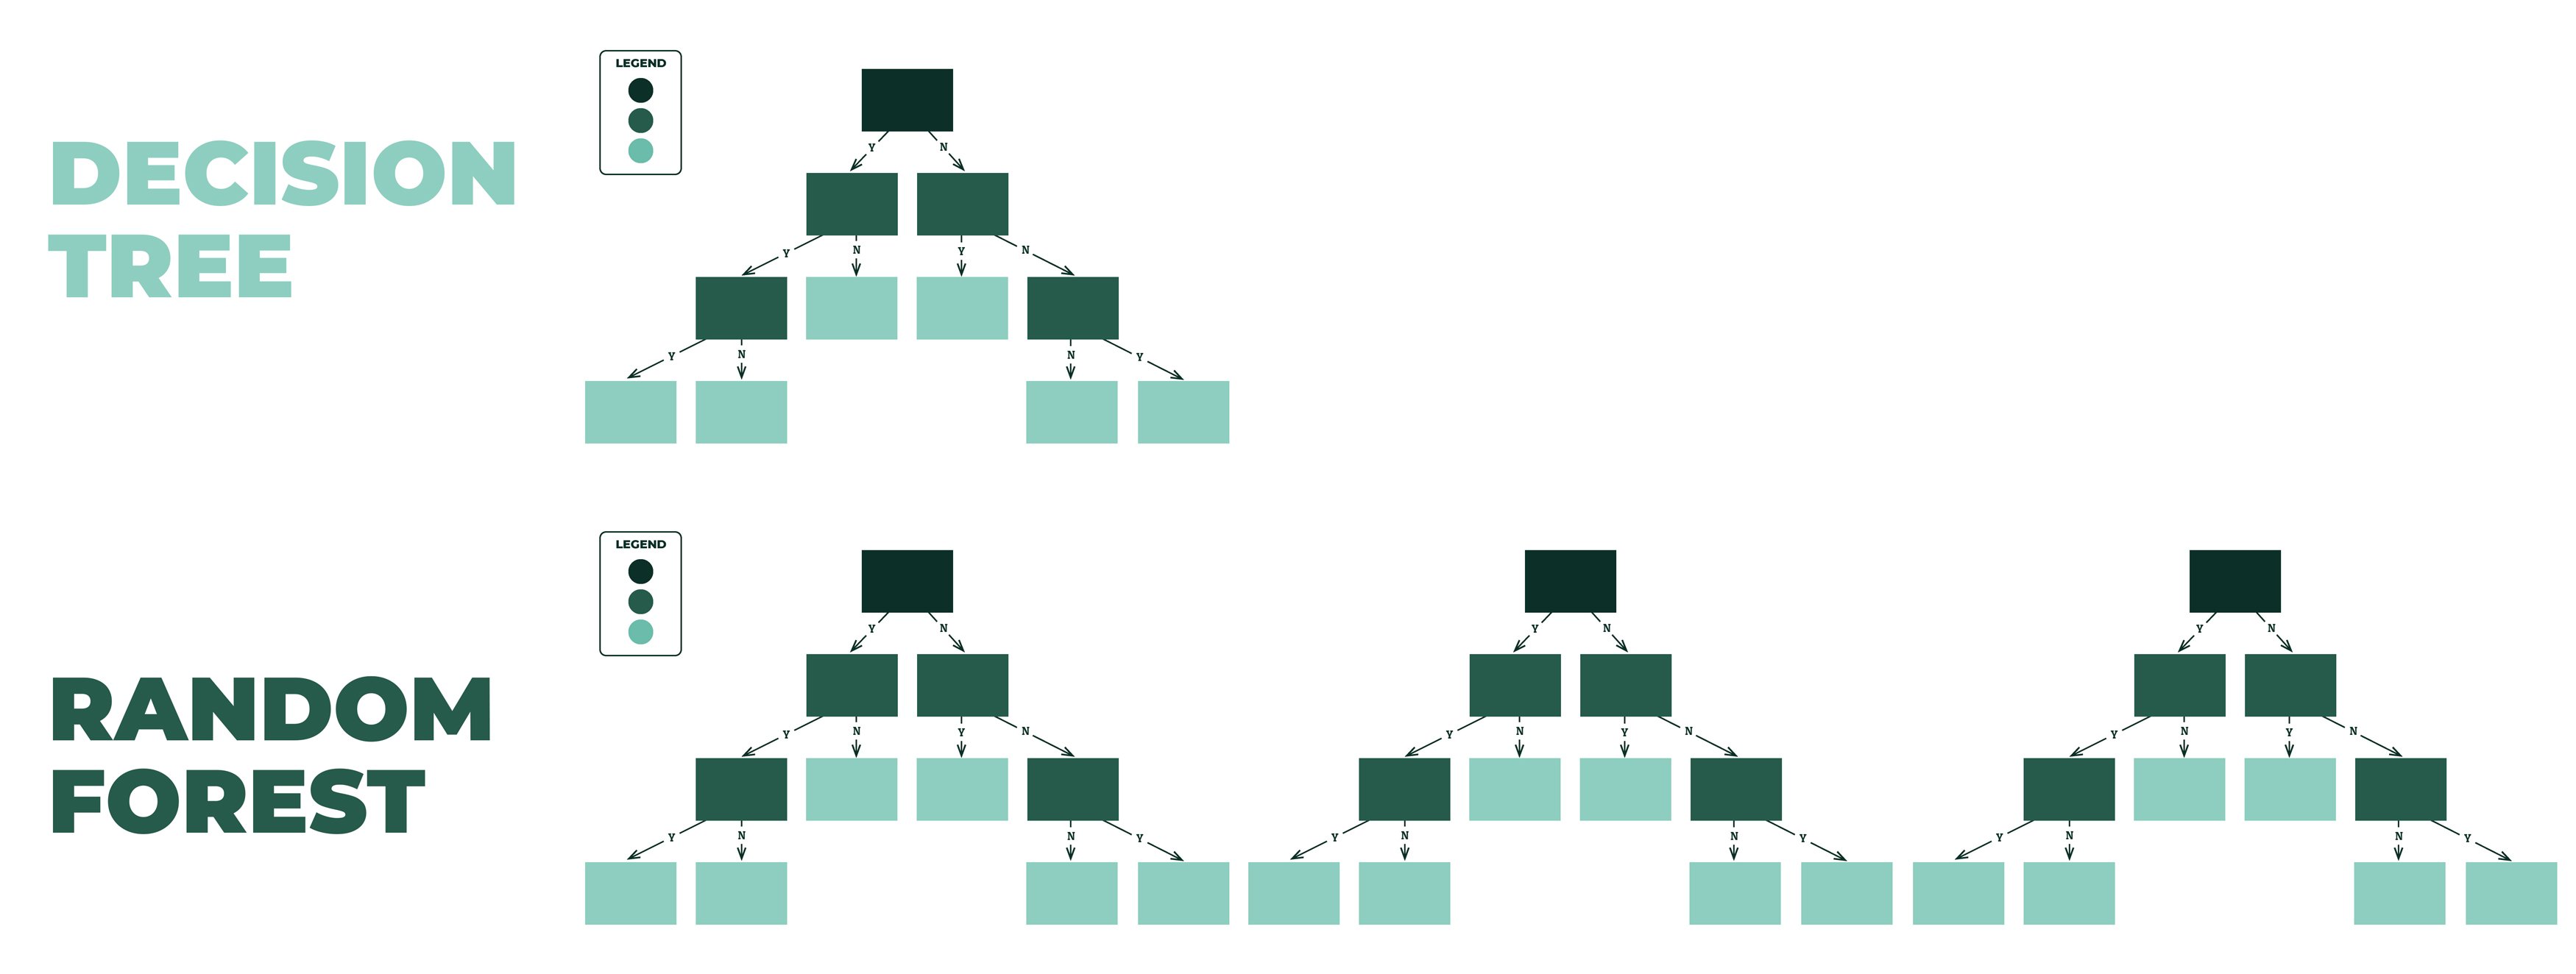
When we bring multiple decision trees together, we make a random forest. Random forests are a form of ensemble learning, which is a method that brings together multiple ‘weaker’ models to inform a ‘stronger’ collective model, helping us to improve accuracy and reduce or balance things like bias and variance.
The fundamentals of a random forest are still the same as a decision tree: we’re training our algorithm to find the answer we are seeking, and it functions the same way a decision tree does. However, in the case of a random forest, we use a bootstrapped dataset (see below to learn more) and split nodes using a random subset of variables at each step. We do this n number of times, making multiple trees.
Instead of having one tree definitively define a prediction, a random forest uses bagging.
Let’s break it down with some tables and graphics!
The first thing we do is bootstrap our dataset. What does that mean? It just means we randomly select records from our original dataset to create a new one.
Observing the table below, you can see that some records were duplicated, and that’s okay! It's intended to be part of the bootstrapping procedure. The data that does not end up as a part of the bootstrapped dataset will later be used to evaluate our model. You can read more about bootstrapping here.
Once you build your bootstrapped dataset, instead of considering all three variables (feathers, lbs, fly) on how to split this node, we let the model randomly select two.
From these two variables, the variable that does the best job separating the samples will be chosen as the root node. The split following the root node will then do the same thing using the remaining variables, to determine what best separates the data, allowing us to predict our animal. Then repeat the process all over again!
Depending on how many times you repeat the process, you end up having multiple trees, and in turn a forest! It might look something like this (with different splits):
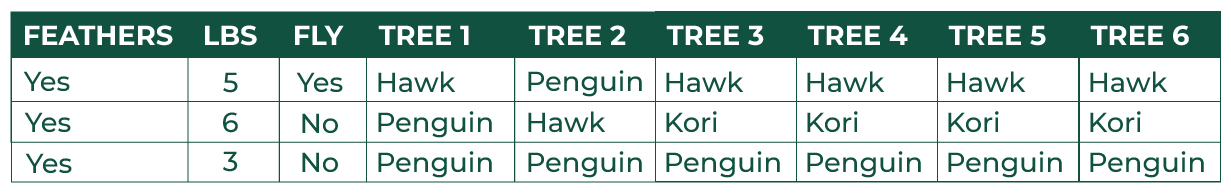
Now let’s imagine that you have hundreds – maybe thousands, of trees. Each of those trees may have different combinations of root and internal nodes, and therefore different lead nodes. Some trees are saying that an animal that weighs under 5lbs, has feathers, and can’t fly are penguins, but other trees are saying they aren’t penguins. If we get a new record of data, how does our algorithm determine what animal it is?
With random forests, we collect votes from all the trees and the majority vote determines what the predicted outcome will be. For example, in the table below we look across many models and determine the winning prediction for the three unknown animals are Hawk, African Kori, and Penguin:
When we bootstrap the data and use aggregates to decide an outcome, this is known as bagging. You can learn more about bagging here.
Once we have our ensemble of models built, it’s time to put them to the test. We’ll use the data samples that were not used during the model building process (known as “Out-of-Bag Samples”), to see how our model performs. How well it can classify the new data points will serve as a measure of how accurate our random forest is. The proportion of out-of-bag samples that were incorrectly classified are known as the out-of-bag error.
If you’re deciding between which algorithm to use for a given situation, as with almost anything in data science, the answer is: it depends. However, here’s the top things I think about when it comes to deciding between the two:
One of the first things I always tend to do is evaluate the size of my data, and then ask how easy I need to be to explain my model. If you have a large dataset and don’t need easy interpretation of how you arrived at your results (and instead prioritizing accuracy), a random forest will be my algorithm of choice.
Random forests are generally robust to changes in data and in turn have a much stronger accuracy and predictive capability in the long run. However, they may not be the fastest to develop, train or deploy.
Decision trees, on the other hand, are great with smaller datasets and are very easy to interpret. I would recommend using decision trees when you need a highly interpretable model deployed quickly. I would also tend to use decision trees when I know that any incoming data would be similar to the trained data of my tree (it does not need to be sensitive to changes in data).
Thanks for reading! I hope this blog helped you better understand how random forests work, how they compare to decision trees, and the different scenarios in which you might pick one over the other. If you would like some help picking the right model for your use case, or need help building robust random forest models for your organization, get in touch with me via the links below! I’m happy to discuss possible use cases for your business and advise on how to best proceed in your given situation.

-2.gif)
If you’re a data enthusiast, analytics professional, or just someone curious about Tableau’s latest innovations, the Tableau Conference 2025 is your...

Tableau Plus is the new premium offering from Tableau, a leading data visualization and business intelligence platform. It builds upon the...

If you've spent any time working with Tableau, you've likely encountered the dreaded "Cannot Mix Aggregate and Non-Aggregate Arguments" error. It's a...