Tableau Conference 2025 | Know Before You Go
If you’re a data enthusiast, analytics professional, or just someone curious about Tableau’s latest innovations, the Tableau Conference 2025 is your...


Mahzabin has been with DataDrive as an Analytics Consultant for six months. Originally from Dhaka, Bangladesh, Mahz attended Winona State University and double majored in Statistics and Data Science. That said, her path to data analytics consulting wasn’t exactly linear. She began college as a Business Administration major, switched to Marketing, then had a period of being undecided, before finally finding Statistics and Data Science (and nearly tripled majored with a degree in Math!). Mahz went on to get her Master’s Degree in Data Science from South Dakota State University.
%20DataDrive%20Edits-0418.jpg?width=2670&name=_%7Bprofessional)%20DataDrive%20Edits-0418.jpg)
Mahz’s exploration of such a wide variety of fields is a direct reflection of the sheer number of things she’s good at. Mahz self-described as an ‘arts girl’ for much of her early life, and growing up had her sights set on architecture. When considering programs for college, her family encouraged her to consider business as it was an easy way to enter the corporate world. Even now, as one of DataDrive’s leading Data Scientists, Mahz can’t stick to one hat- outside of work she is a budding musician with music on Youtube and Spotify.
As she transitioned to tech, Mahz found a community that welcomed her. She discovered that data science was the perfect blend between two of her greatest passions, science and art! Now, as an Analytics Consultant with DataDrive, she combines data science with her artful eye to create data visualizations that efficiently solve problems, help clients make better business decisions, and are absolutely stunning to boot!
One of DataDrive's core values is to celebrate each other often. I want to celebrate Mahzabin not just for her contributions to DataDrive, but for the beautiful music she shares with the world, as well as her data science work !
Mahz shares song covers in both Bangla and English on her Youtube channel. This is my personal favorite of Mahz's Bengali covers on Youtube, though I'll admit it was hard to choose just one. I find this arrangement and Mahz's voice both soothing and invigorating, which is the perfect combination for my work day- in fact I've been listening to it on repeat as I write this blog!
I already enjoy Hozier, but in terms of what my ears savor, Mahz's cover of Cherry Wine genuinely rivals the original. Mahz's voice is both soft and strong in this remarkable cover.
I also want to highlight Mahz's contributions to Tableau Public-
She posts data visualizations as a part of Makeover Monday. This viz highlights Mahz's commitment to data accessibility and making sure the user understands the data they are interacting with, as well as her talent for making sure the vizzes look especially sharp.
Do you have any advice for your younger self?
You’re smarter than you think. Stop doubting yourself, just keep working really hard and you will be exactly where you’re supposed to be.
What has been the biggest challenge you’ve encountered thus far?
One of my biggest personal and professional challenges is my lack of confidence. I am always questioning whether I am good enough and am constantly comparing my work to others. I haven’t overcome it yet, but I’m working on it.
I try to remind myself that we all work in different ways and at different paces. I am not supposed to know EVERYTHING. No one knows everything. It’s these gentle daily reminders that keep me sane. .jpg?width=2802&name=Image%20from%20iOS%20(3).jpg)
How would you like to see these challenges prevented in the future?
By celebrating each other every day! Being appreciative and supporting each other goes a long way. That’s one of the many things DataDrive is excellent at!
How do you feel about the accessibility of tech? Do you think it’s truly a field for anyone?
Absolutely! If you have the passion for it and enjoy spending precious hours of your life working in tech, it’s yours! If you can do the job right, does it matter what gender, race, or sex you are? I think not.
Do you think tech has become more accessible since you started your journey?
I think it is becoming more accessible day by day.
Do you have any projects, initiatives, or goals to make the tech industry more inclusive?
I have an initiative in mind that I’m very excited to research. To give you a little background, this project would involve studying gender bias in Primary School STEM classes in Bangladesh. I am originally from Bangladesh, and I am always looking for ways to contribute to society. I have a peer back home named Maisha who is currently researching and collecting student and teacher information on classroom behavior in multiple schools. I am interested in using that data for text analysis that will utilize natural language processing.
Maisha Ahmed is currently completing her thesis for her Master's in Education Leadership and School Improvement. She is collecting data by reaching out to teachers in schools across Bangladesh and gathering information about their teaching style and experiences in class. She has a list of questions for every teacher and records their responses, then translates those answers into qualitative data. The questions range from whether the teacher believes in equal opportunity to significant details about how the teacher treats the students in science classes. The goal of Maisha's research is to determine the perception that science teachers in primary schools have regarding boys and girls and how they perform in their classrooms. She also seeks to identify what teaching and learning methods are practiced in their science classes to encourage participation of all genders.
-2.gif)
If you’re a data enthusiast, analytics professional, or just someone curious about Tableau’s latest innovations, the Tableau Conference 2025 is your...

Tableau Plus is the new premium offering from Tableau, a leading data visualization and business intelligence platform. It builds upon the...

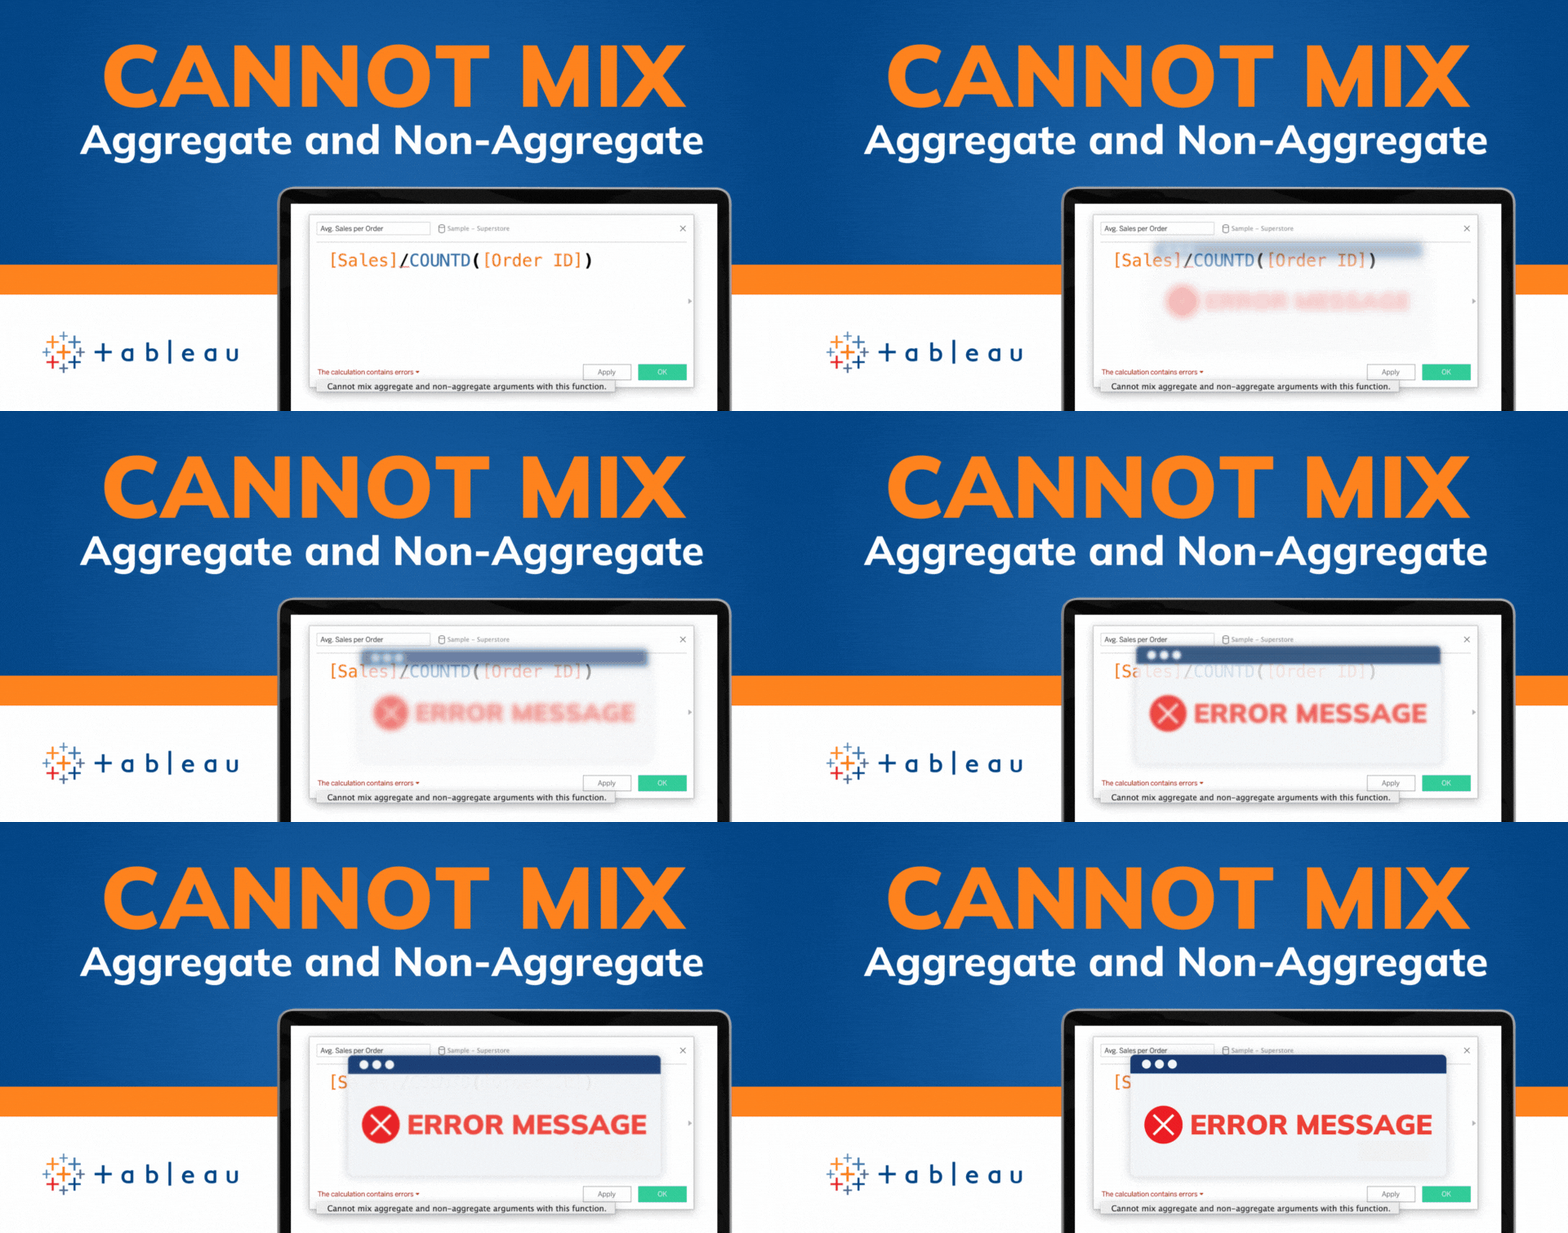
If you've spent any time working with Tableau, you've likely encountered the dreaded "Cannot Mix Aggregate and Non-Aggregate Arguments" error. It's a...