

 Mahzabin Khan


Tableau Conference 2025 | Know Before You Go
If you’re a data enthusiast, analytics professional, or just someone curious about Tableau’s latest innovations, the Tableau Conference 2025 is your...
Welcome to Part II of learning about outliers! In my previous blog, I discussed what an outlier is, where they come from, and how to differentiate between outliers, high leverage points, and influential points. In this blog, I’ll walk through univariate approaches (data containing only one variable) for detecting and diagnosing outliers.
So, without any further ado, let’s get started!
The simplest way to detect outliers is by drawing box plots. Box plots, also known as box and whisker plots, are an easy way to observe the distribution of the data you’re analyzing. The box demonstrates the central 50% of the data, with a line in the middle that shows the median value. The lines extending from the box capture the range of the remaining data. Any data point that falls outside the lines indicates an outlier. In the plot below, we can see that the red dot sitting outside of the boxplot is an outlier:
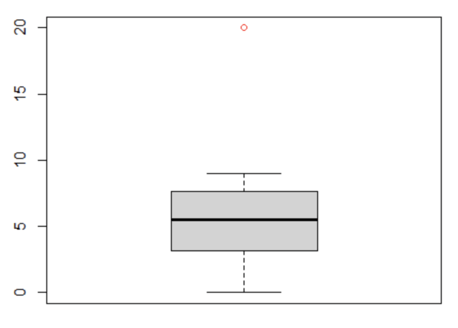
R code for drawing boxplot:
boxplot( x, outcall = “red” )
See the section on Interquartile Range below for more information on how we arrive at the minimum and maximum values depicted by lines used to determine our outlier thresholds.
Calculating the Z-score provides a way to understand how far the data points are from the mean. For example, knowing someone’s test score was 82% might be good information, however, if you want to compare it to the average person’s score then you would want to look at the Z-score. The Z-score will be able to show you what the test score is in comparison to the average population’s mean score, all while accounting for the natural ‘spread’ of the data.
Z-score formula = (xi - mean) / standard deviation
R code for calculating Z-score:
thresh<- 3
mean<- mean(x)
std<- sd(x)
library(tidyverse)
data<- data %>%
mutate(zscore = (x - mean(x))/sd(x))
data<- data %>%
mutate(data,outlier= ifelse(zscore>thresh, "Outlier", "Not Outlier"))
Here I use the tidyverse package in R to help calculate the z-score for this example. Running this R-code will add two columns in your dataset, one that shows the z-score for each xi and one that indicates whether it is an outlier or not. From the output we can see that the data has one outlier:
The Interquartile range (IQR) consists of the central 50% of the data, and contains the majority of your data points. In a boxplot, the IQR is the box portion between the first and the third quartile. IQR can be used to calculate the lower and upper bounds of the data, which helps identify outliers.
R Code for an IQR function that returns exact values of your outliers:
IQR_function <- function(x) {
Q1<-quantile(x,0.25)
Q3<-quantile(x,0.75)
IQR<-(Q3-Q1)
left<- (Q1-(1.5*IQR))
right<- (Q3+(1.5*IQR))
c(x[x <left],x[x>right])
}
IQR_function(x)
This function calculates the lower (Q1) and upper (Q2) bounds of the interquartile range of your data, then finds the minimum and maximum limits. It then outputs the exact value of the outliers in your data.
Dixon’s Q Test can be used to identify a single outlier based on a hypothesis. This is typically used on a smaller sample ( greater than 3 and less than 30 ) and the data is assumed to be normally distributed.
Null hypothesis (H0): There are no outliers in the data
Alternate hypothesis (Ha): The maximum or minimum value is an outlier
R code and Output:
Since the p-value is less than 0.05, we have enough evidence to reject the null hypothesis and conclude that the maximum value twenty is an outlier.
Grubb’s Test is also a hypothesis-based approach similar to Dixon’s Test. However, this test can be used for a sample size greater than 6 and the data is normally distributed.
Null hypothesis (H0): There are no outliers in the data
Alternate hypothesis (Ha): The maximum or minimum value is an outlier
I’m using the Grubbs.test from the outliers package in R. From the output above we can see that the p-value is less than 0.05, which means we have enough evidence to reject the null hypothesis and state that the maximum value 20 is an outlier.
If you’re working with multiple independent variables There are more advanced statistical tests made specifically for bivariate and multivariate datasets, however, that is beyond the scope of this blog. If you’re curious, check out this blog that goes into more detail!
When you encounter outliers in your data, there are a few ways to proceed
If there is no reasonable scientific basis for an outlier to exist in the dataset, one of the easy ways to tackle the issue is to simply remove the data point and pretend like it was never there.
If you have just a few data points that are outliers, you could replace them with the next closest value to the median. This approach will allow the distribution to be the least affected.
Another way to tackle outliers is by replacing them with the mean of the remaining values without the outlier. With this approach you run the risk of distorting the distribution, so oftentimes analysts prefer to use option two.
Oftentimes, outliers are overlooked by analysts. As the use of statistical software and pre-packaged functions continues to grow, analysts need to be extra vigilant to avoid believing that the results returned by their analysis are accurate, when in reality there are outliers skewing the results. Always remember to check the data for outliers to avoid bias and incorrect results in your study.
It is a good practice to conduct your analysis using the full data both with AND without the outliers. If the results are similar, it is better to use the original data.
I hope this blog has given you some practical tips on how to detect and deal with outliers in your datasets. If you’re struggling to get accurate results from your own models and would like to work with our team of experts, feel contact us using the link below.
Happy Outlier hunting!
-2.gif)
If you’re a data enthusiast, analytics professional, or just someone curious about Tableau’s latest innovations, the Tableau Conference 2025 is your...

Tableau Plus is the new premium offering from Tableau, a leading data visualization and business intelligence platform. It builds upon the...

If you've spent any time working with Tableau, you've likely encountered the dreaded "Cannot Mix Aggregate and Non-Aggregate Arguments" error. It's a...