

 Mahzabin Khan
Tableau Conference 2025 | Know Before You Go
If you’re a data enthusiast, analytics professional, or just someone curious about Tableau’s latest innovations, the Tableau Conference 2025 is your...
A crucial step for any type of data analysis consists of getting a good understanding of the data itself (often referred to as ‘Exploratory Data Analysis’, or EDA). One of the top things that should be discovered in the initial analysis phase is whether or not the data consists of any outliers.
In this blog, I will go over some basic concepts of outliers, including what an outlier is, where they come from, how they impact data, and how to differentiate between outliers, high leverage points, and influential points.
So, let’s get started!
Simply put, outliers are data points that are prominently ‘further away’ from the rest of the data points. What constitutes ‘further away’ is ultimately up to you as the analyst (or your team) to decide, but is often influenced by things like the general distribution of your data points, and often characterized by descriptive statistics of your observations (median, average, percentiles, etc.).
There are many causes that can lead to outliers being present in the data. The most common causes are:
Having outliers in a dataset can greatly impact statistical analysis and skew results. Analysts typically use mean, median, and mode to describe the ‘center’ of the data. Among these measures, mean is the only one that is significantly affected by outliers.
Outliers can also increase the error variance and decrease the power of statistical tests. Moreover, they can highly impact the assumptions of linear regression. To learn more about these assumptions, jump over to this blog!
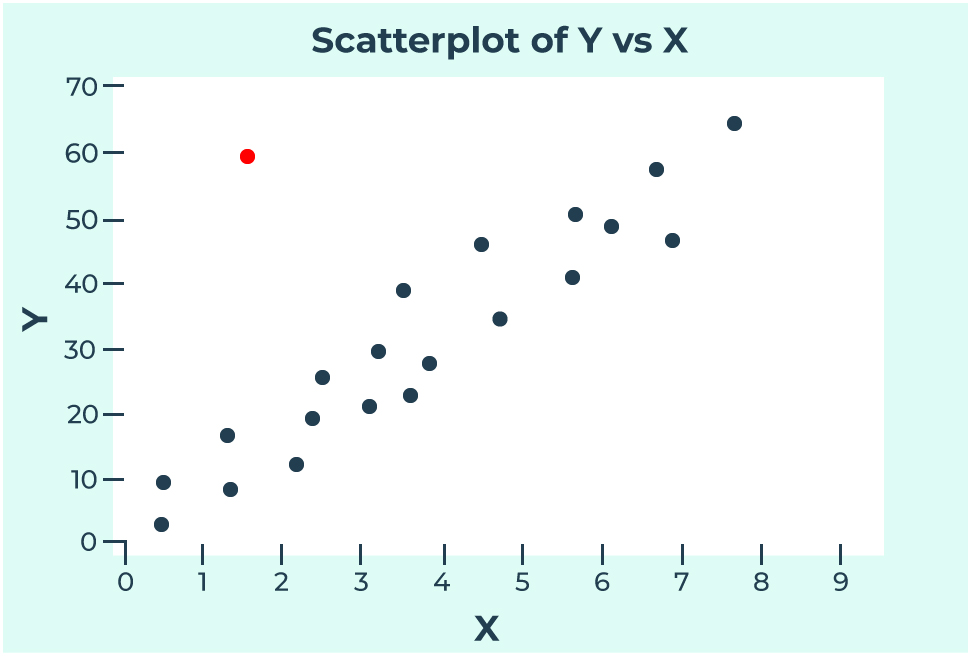
A data point is called an outlier specifically when the response value (y) is extreme and does not follow the pattern of the rest of the data. In the plot below, you can notice how all the blue dots follow a noticeable trend, whereas the red dot seems to stick out from the rest. This red dot is an outlier since it has an extreme y value given its position on the x-axis.
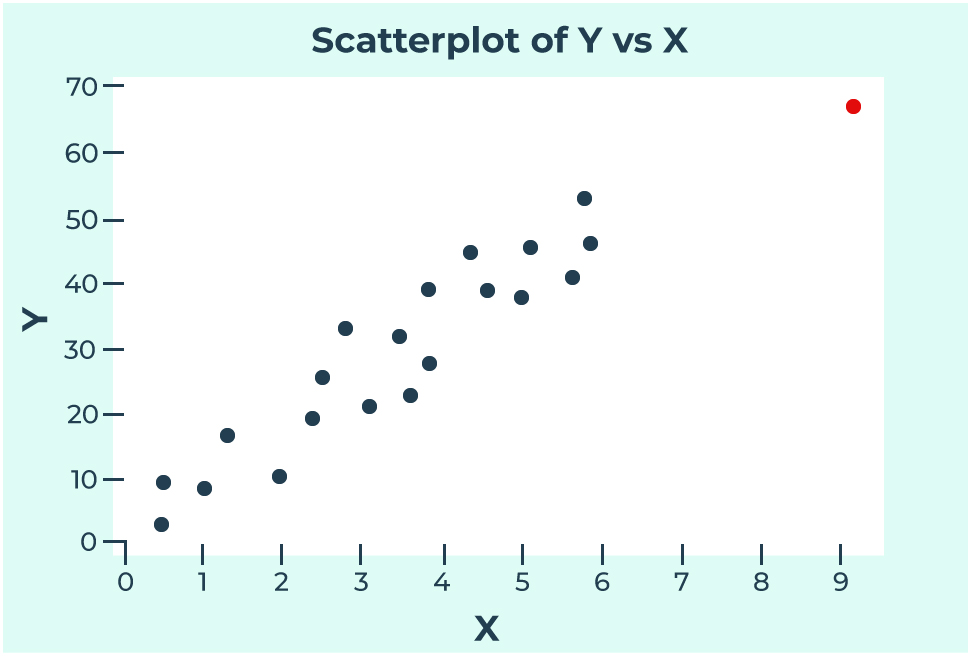
A data point is considered to be a high leverage point if it has an extreme independent value (x), and does not follow the general pattern of the rest of the data. In the plot below, we can see that the red dot is following the general trend of the data, but sits apart from the other x values. This means that this red data point has high leverage.
A data point is considered to be influential if it significantly impacts the results of a regression analysis. These could include hypothesis test results and estimated slope coefficients. It should be noted that outliers and high leverage points can also be influential, but the only way to verify that is by investigating whether or not the data point is actually influential in your results.
One of the ways to confirm whether a data point is influential is by drawing two best-fitted lines with and without the data point (shown below). If the two lines are substantially different, then it is an influential point.
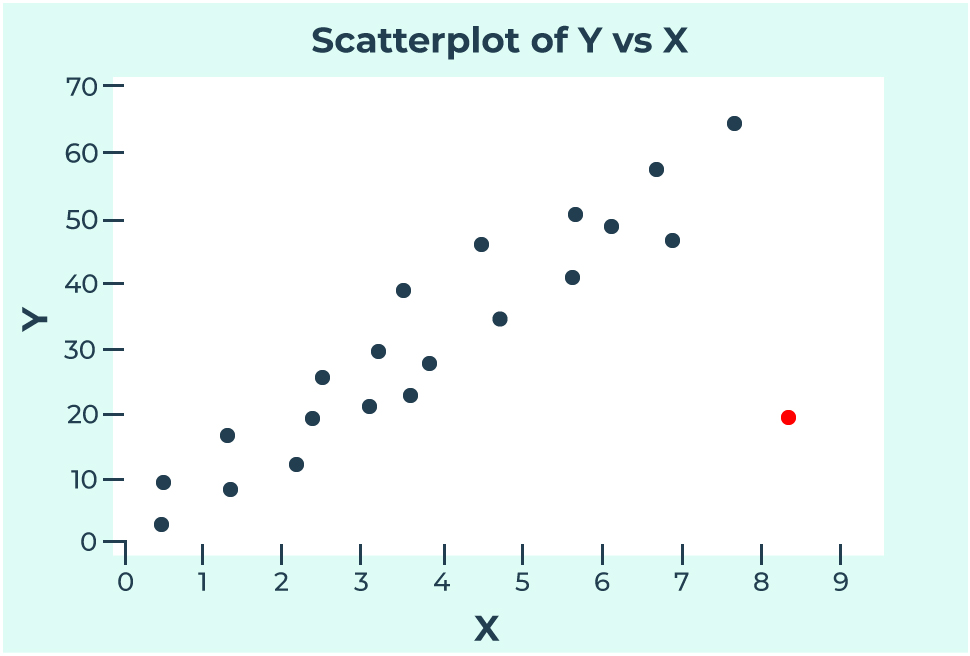
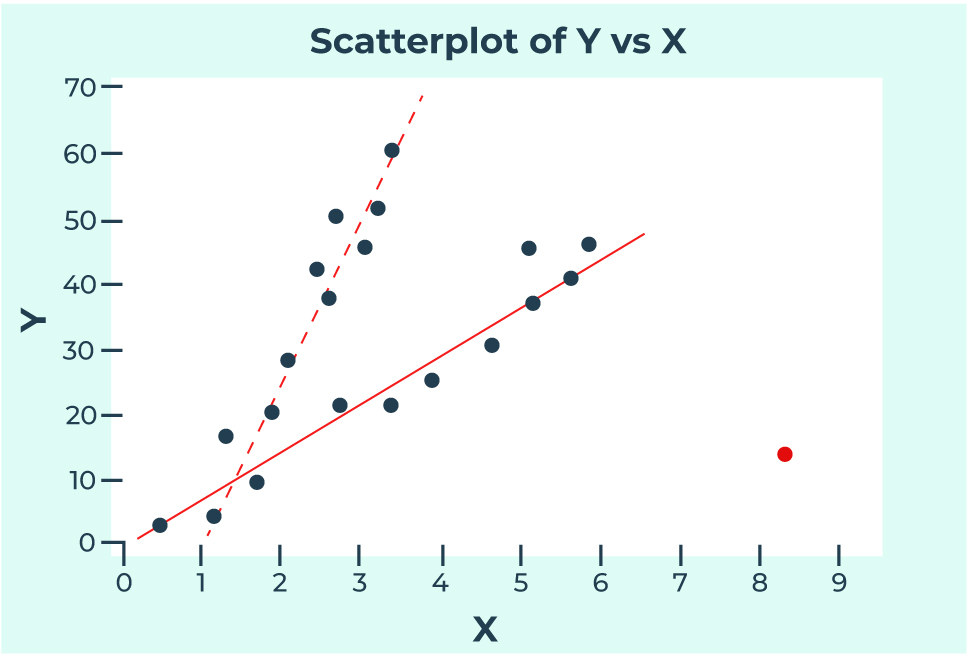
For example, in the plot below we can see that the red data point is not following the general trend of the data. On top of that, this data point also has an extreme x value. This point would be considered an outlier that has high leverage.
After drawing two best-fitting lines, one including the outlier, and one excluding it, we can see that they are very different from each other. In the plot, the solid line refers to the regression equation with the red dot, and the dashed line refers to the regression equation without the red dot. Since the slope is significantly smaller for solid line, we can say that this red dot is also an influential point.
Images referenced from https://online.stat.psu.edu/stat462/node/170/
And there you have it! Hopefully you now have a deeper understanding of what an outlier is, including being able to distinguish if the point is influential or high leverage.
This can be particularly useful when cleaning and prepping your data, or diagnosing unexpected results that may have been influenced by outliers in your dataset.
In my next blog, I’ll go into more detail on how to detect outliers.
I hope this blog answered some of your questions and helped you in your data journey. If you’re struggling to get the results you desire from your own models or would like an expert opinion on how statistics and data science can unlock new opportunities for your organization, feel free to reach out to me using the link below!
-2.gif)
If you’re a data enthusiast, analytics professional, or just someone curious about Tableau’s latest innovations, the Tableau Conference 2025 is your...

Tableau Plus is the new premium offering from Tableau, a leading data visualization and business intelligence platform. It builds upon the...

If you've spent any time working with Tableau, you've likely encountered the dreaded "Cannot Mix Aggregate and Non-Aggregate Arguments" error. It's a...