Snowflake ELT Automation
Recently, I was assisting an analytics team with implementing a Snowflake cloud data warehouse....

Recently, I was assisting an analytics team with implementing a Snowflake cloud data warehouse....
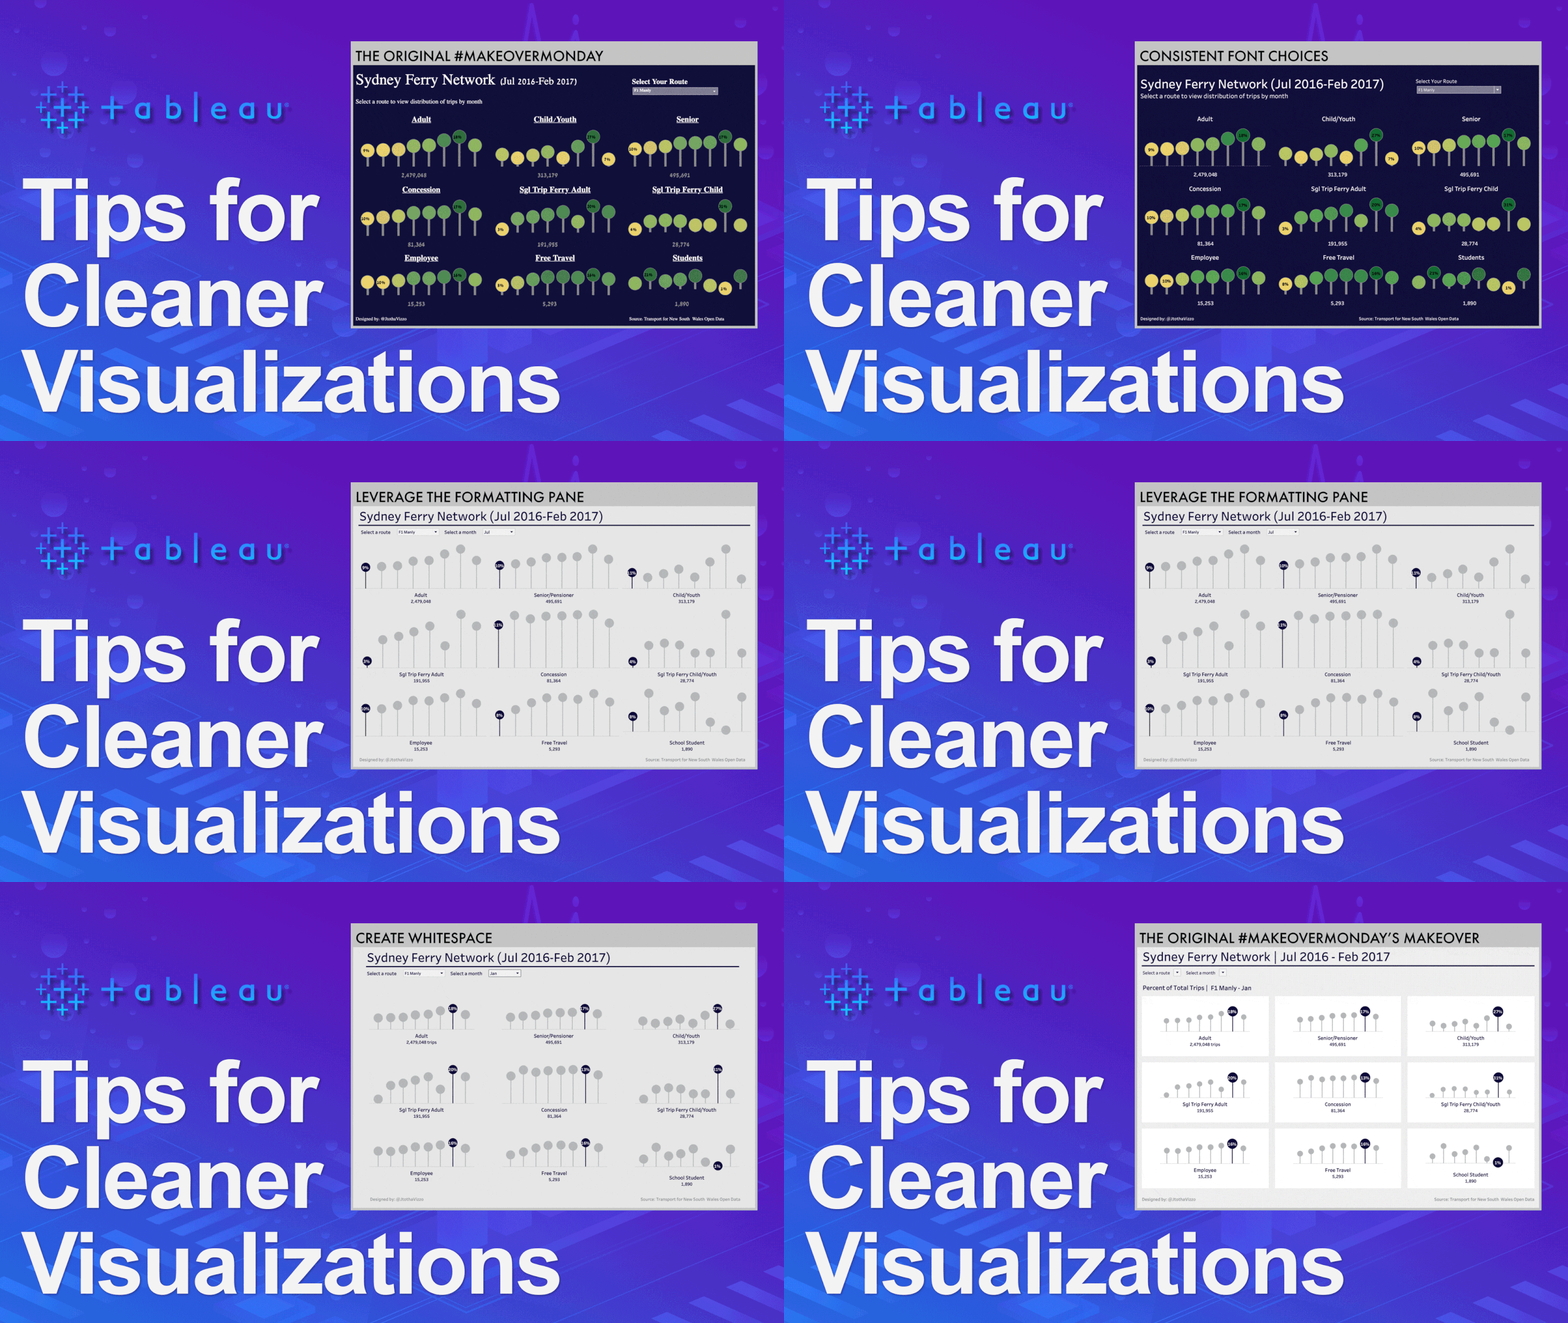
On April 30th, 2017 I published my very first Makeover Monday visualization to Tableau Public. It...

In most cases, a trial period is a great way to get introduced to a new tool and evaluate if its...
So you acquired all this of this awesome data and you’re asked to build a model to predict an...

With the Salesforce acquisition of Tableau, a popular question is - how can Einstein’s powerful...

Analytics Consultant Sam Epley walks us through how he completed his week 49 challenge over at the...

With the proliferation of data analysis tools out there, and the growing ability to use them in...
Leading up to the 2020 NBA Draft, I shared a Tableau Public visualization called NBA Draft Gems,...

As an Analytics Consultant, it’s my responsibility to leverage Tableau and other tools to develop...

Have you ever had the need to zoom in and zoom out on a chart? Have you needed to be able to see...
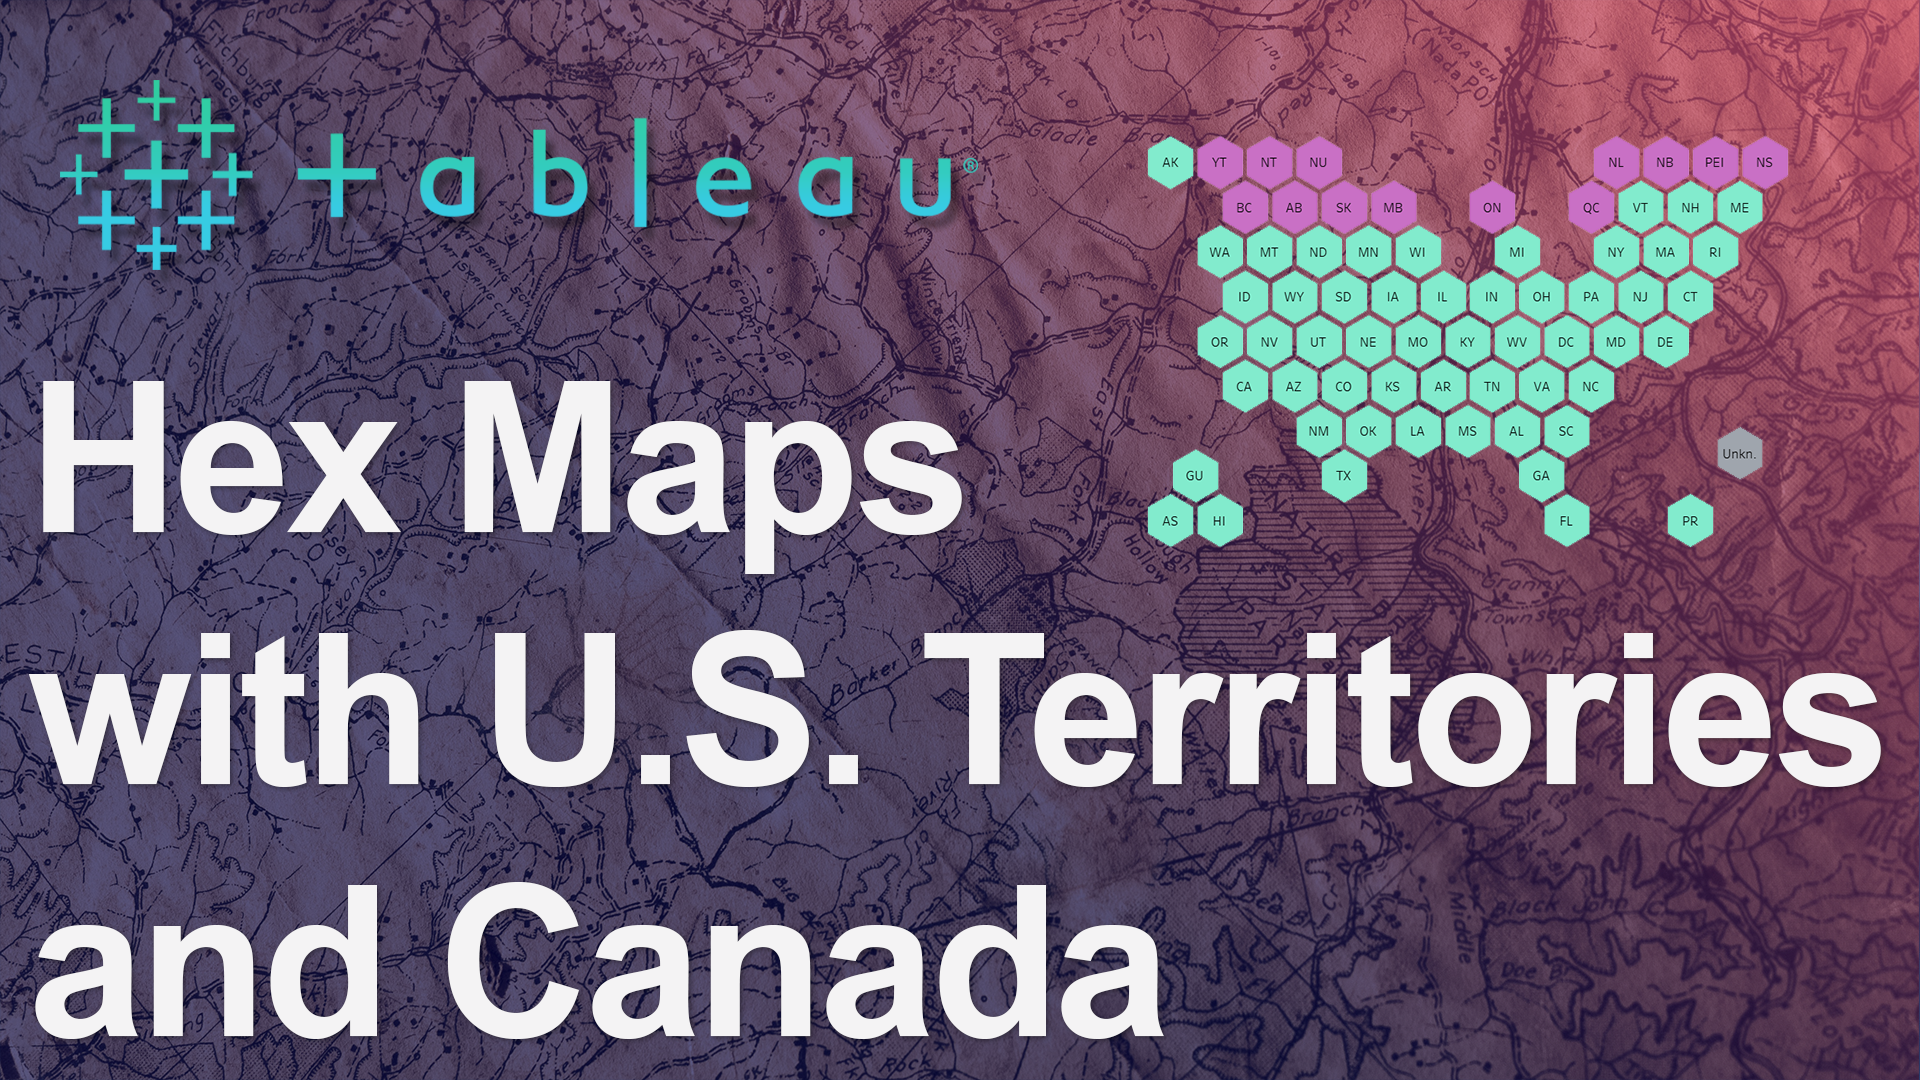
Web maps are tricky. Let's say you are using a dataset to compare sales across states and provinces...

Tableau’s latest quarterly release in Q1 2020 was jam packed with amazing features that have...

Once upon a time, every great dashboard I built used floating objects for almost everything. It was...
I recently sat in on a user acceptance testing (UAT) meeting. We are in the final stages of UAT and...

More and more we are seeing companies offer at least a portion, if not all, of their services in...

A few weeks ago, Luke Komiskey and I had the chance to head down to Orlando, Florida for the annual...

There are three levels of Tableau Desktop certifications (Specialist, Certified Associate, and...